Connect your Spark Databricks clusters Log4J output to the Application Insights Appender. This will help you get your logs to a centralized location such as App Insights. Many of my customers have been asking for this along with getting the Spark job data from the cluster (that will be a future project).
I also added Log Analytics so that the server metrics will be captured and placed in Azure Monitor.
This project as been extended as a JAR file by Jeremy Peach: https://github.com/AnalyticJeremy/Azure-Databricks-Monitoring. The JAR file will install configure this Spark listener upon the cluster creation.
- Create Application Insights in Azure
- Get your instrumentation key on the overview page
- Replace APPINSIGHTS_INSTRUMENTATIONKEY in the appinsights_logging_init.sh script
- Create a Log Analytics account in Azure
- Get your workspace id on the overview page
- Get your primary key by clicking Advanced Settings | Connected Sources | Linux and copy primary key
- Replace LOG_ANALYTICS_WORKSPACE_ID in the appinsights_logging_init.sh script
- Replace LOG_ANALYTICS_PRIMARY_KEY in the appinsights_logging_init.sh script
- Get your primary key by clicking Advanced Settings | Data | Linux Performace Counters and click "Apply below configuration to my machines" then press Save
- Click the Add button (The UI should turn to a grid) then press Save
- Create Databricks workspace in Azure
- Install Databricks CLI
- Open your Azure Databricks workspace, click on the user icon and create a token
- Run "databricks configure --token" to configure the Databricks CLI
- Run Upload-Items-To-Databricks.sh (change the .bat for Windows). Linux you need to do a chmod +x on this file to run.
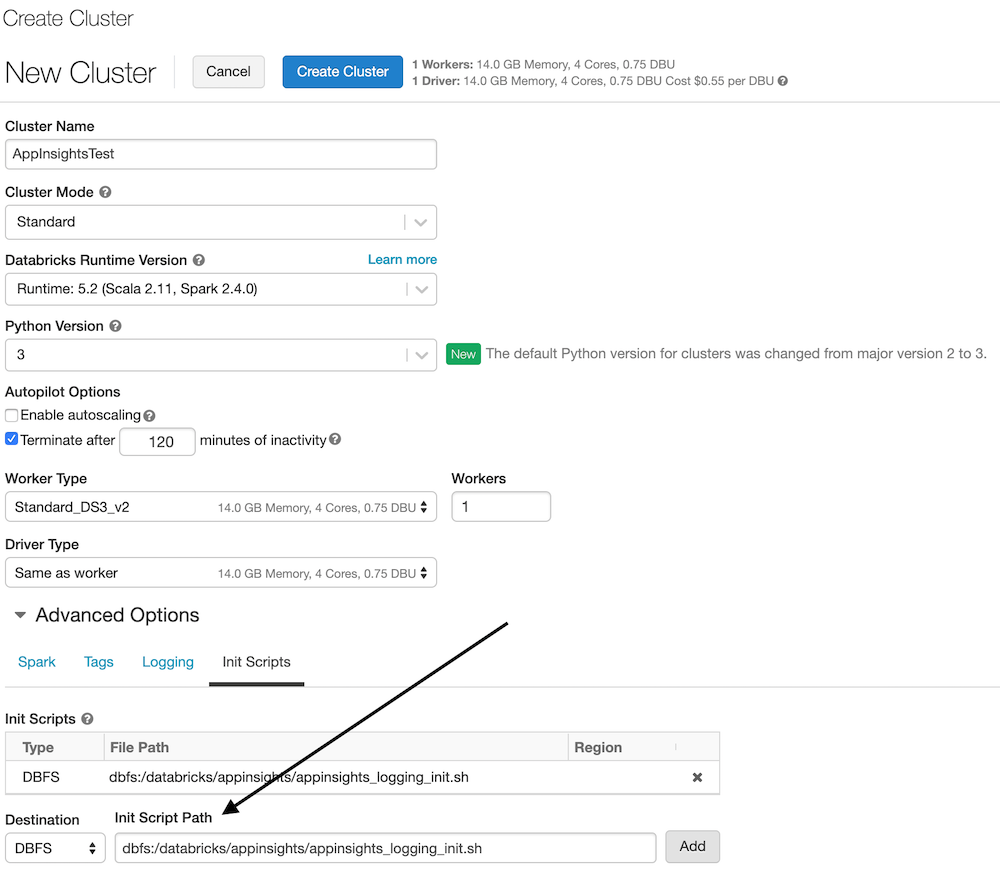
- Create a cluster in Databricks (any size and shape is fine)
- Start the cluster
- Install the
applicationsightsPython package from PyPi to the cluster.- This provides the ability to send custom events and metrics to app insights.
- You'll need to follow this step if you plan on logging Custom Metrics or Events to App Insights on Pyspark.
- Steps to install a library on Azure Databricks
- Import the notebooks in AppInsightsTest
- Run the AppInsightsTest Scala notebook
- Cell 1 displays your application insights key
- Cell 2 displays your jars (application insights jars should be in here)
- Cell 3 displays your log4j.properities file on the "driver" (which has the aiAppender)
- Cell 4 displays your log4j.properities file on the "executor" (which has the aiAppender)
- Cell 5 writes to Log4J so the message will appear in App Insights
- Cell 6 writes to App Insights via the App Insights API. This will show as a "Custom Event" (customEvents table).
- Run the AppInsightsPython Python notebook.
- Cell 1 creates a reference to the Log4J logger (called aiAppender) and writes to Log4J so the message will appear in App Insights.
- Cell 2 configures the connection to App Insights via the
appinsightspackage. - Cell 3 writes to App Insights via the App Insights API. This will show as a "Custom Event" (customEvents table).
- Open your App Insights account in the Azure Portal
- Click on Search (top bar or left menu)
- Click Refresh (over and over until you see data)
- For a new App Insights account this can take 10 to 15 minutes to really initialize
- For an account that is initialized expect a 1 to 3 minute delay for telemetry
-
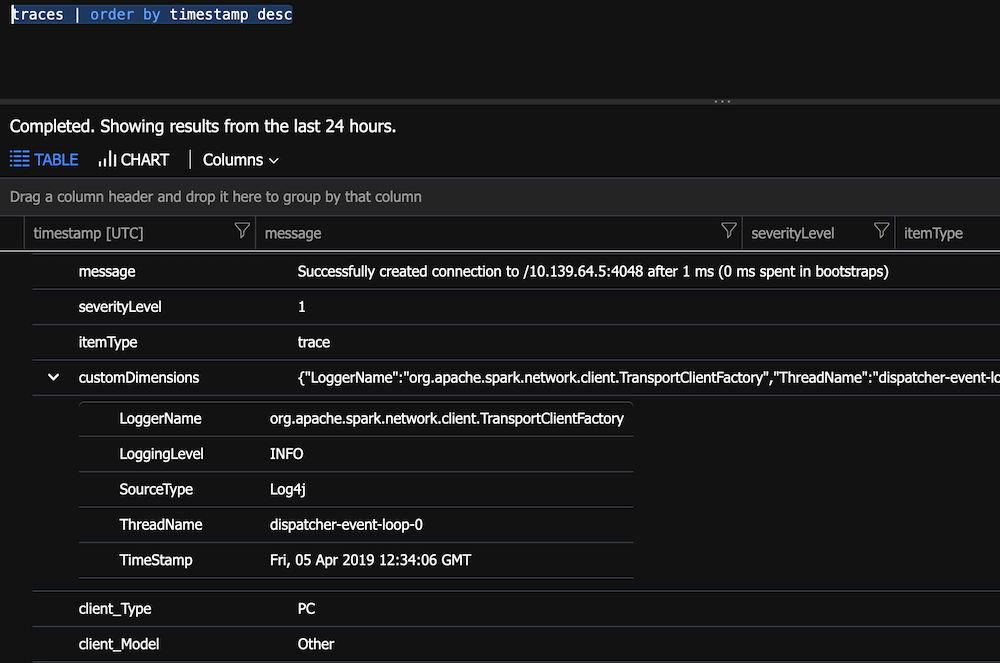
This means the data will be in the customDimensions field as a property bag
-
Open the Analytic query for App Insights
-
Run
traces | order by timestamp desc- You will notice how customDimensions contains the fields
-
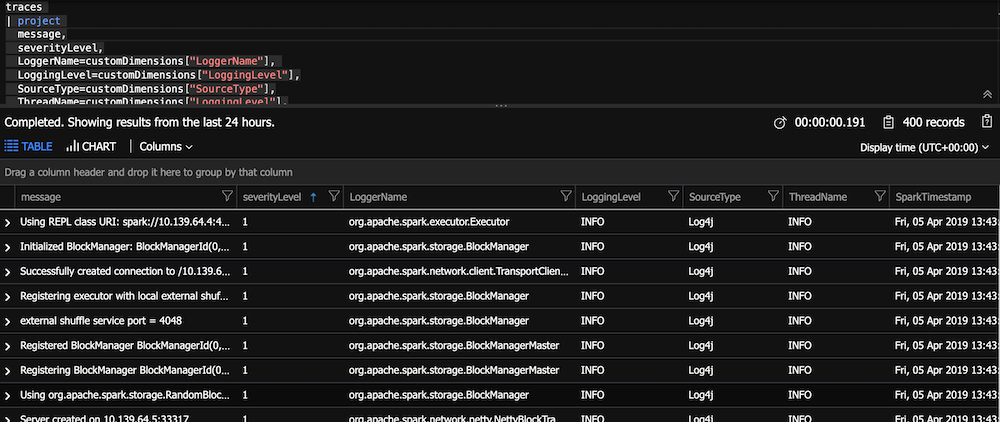
Parse the custom dimensions. This will make the display easier.
traces
| project
  message,
  severityLevel,
  LoggerName=customDimensions["LoggerName"],
  LoggingLevel=customDimensions["LoggingLevel"],
  SourceType=customDimensions["SourceType"],
  ThreadName=customDimensions["LoggingLevel"],
  SparkTimestamp=customDimensions["TimeStamp"],
  timestamp
| order by timestamp desc
- Run
customEvents | order by timestamp descto see the custom event your Notebook wrote - Run
customMetrics | order by timestamp descto see the HeartbeatState - Don't know which field has your data:
traces | where * contains "App Insights on Databricks" - Open your Log Analytics account
By running the below code (in a notebook cell), each Spark job will start to begin to have data logged for you that you can then query in App Insights.
// https://spark.apache.org/docs/2.1.0/api/java/org/apache/spark/scheduler/SparkListener.html
// https://spark.apache.org/docs/2.2.0/api/java/org/apache/spark/scheduler/SparkListenerJobStart.html
// https://spark.apache.org/docs/2.2.0/api/java/org/apache/spark/scheduler/SparkListenerJobEnd.html
// https://spark.apache.org/docs/2.2.0/api/java/org/apache/spark/scheduler/SparkListenerStageCompleted.html

import com.microsoft.applicationinsights.TelemetryClient
import com.microsoft.applicationinsights.TelemetryConfiguration
import org.apache.spark.scheduler._
import java.util._
import scala.collection.JavaConverters._

val configuration = com.microsoft.applicationinsights.TelemetryConfiguration.createDefault()
configuration.setInstrumentationKey(System.getenv("APPINSIGHTS_INSTRUMENTATIONKEY"))
val telemetryClient = new TelemetryClient(configuration)

class CustomListener extends SparkListener  {

  override def onJobStart(jobStart: SparkListenerJobStart) {
    val properties = new HashMap[String, String]()
    properties.put("jobId", jobStart.jobId.toString)
    properties.put("clusterId", spark.conf.get("spark.databricks.clusterUsageTags.clusterId"))
    properties.put("clusterName", spark.conf.get("spark.databricks.clusterUsageTags.clusterName"))


    val metrics = new HashMap[String, java.lang.Double]()
    metrics.put("stageInfos.size", jobStart.stageInfos.size)
    metrics.put("time", jobStart.time)

    telemetryClient.trackEvent("onJobStart", properties, metrics)
  }


  override def onJobEnd(jobEnd: SparkListenerJobEnd): Unit = {
    val properties = new HashMap[String, String]()
    properties.put("jobId", jobEnd.jobId.toString)
    properties.put("clusterId", spark.conf.get("spark.databricks.clusterUsageTags.clusterId"))
    properties.put("clusterName", spark.conf.get("spark.databricks.clusterUsageTags.clusterName"))
    properties.put("jobResult", jobEnd.jobResult.toStringStart.jobId.toString)

    val metrics = new HashMap[String, java.lang.Double]()
    metrics.put("time", jobEnd.time)

    telemetryClient.trackEvent("onJobEnd", properties, metrics)
  }


  override def onStageCompleted(stageCompleted: SparkListenerStageCompleted): Unit = {

    val properties = new HashMap[String, String]()
    properties.put("stageId", stageCompleted.stageInfo.stageId.toString)
    properties.put("name", stageCompleted.stageInfo.name)
    properties.put("clusterId", spark.conf.get("spark.databricks.clusterUsageTags.clusterId"))
    properties.put("clusterName", spark.conf.get("spark.databricks.clusterUsageTags.clusterName"))

    val metrics = new HashMap[String, java.lang.Double]()
    metrics.put("attemptNumber", stageCompleted.stageInfo.attemptNumber)
    metrics.put("numTasks", stageCompleted.stageInfo.numTasks)
    //metrics.put("submissionTime", (stageCompleted.stageInfo.submissionTime.toString).toDouble)
    //metrics.put("completionTime", (stageCompleted.stageInfo.completionTime.toString).toDouble)
    metrics.put("executorDeserializeTime", stageCompleted.stageInfo.taskMetrics.executorDeserializeTime)
    metrics.put("executorDeserializeCpuTime", stageCompleted.stageInfo.taskMetrics.executorDeserializeCpuTime)
    metrics.put("executorRunTime", stageCompleted.stageInfo.taskMetrics.executorRunTime)
    metrics.put("resultSize", stageCompleted.stageInfo.taskMetrics.resultSize)
    metrics.put("jvmGCTime", stageCompleted.stageInfo.taskMetrics.jvmGCTime)
    metrics.put("resultSerializationTime", stageCompleted.stageInfo.taskMetrics.resultSerializationTime)
    metrics.put("memoryBytesSpilled", stageCompleted.stageInfo.taskMetrics.memoryBytesSpilled)
    metrics.put("diskBytesSpilled", stageCompleted.stageInfo.taskMetrics.diskBytesSpilled)
    metrics.put("peakExecutionMemory", stageCompleted.stageInfo.taskMetrics.peakExecutionMemory)

    telemetryClient.trackEvent("onStageCompleted", properties, metrics)
  }
}

val myListener=new CustomListener
sc.addSparkListener(myListener)
- The sed command in the appinsights_logging_init.sh could be smarter. I just needs to append versus a full replace.
- For query help see: https://docs.microsoft.com/en-us/azure/kusto/query/
- Show this data in Power BI: https://docs.microsoft.com/en-us/azure/azure-monitor/app/export-power-bi
- You can pin your queries to an Azure Dashboard: https://docs.microsoft.com/en-us/azure/azure-monitor/app/app-insights-dashboards
- You can configure continuous export your App Insights data and send to other systems. Create a Stream Analytics job to monitor the exported blob location and send from there.
- Set up alerts: https://docs.microsoft.com/en-us/azure/azure-monitor/platform/alerts-log-query
- You can get JMX metrics: https://docs.microsoft.com/en-us/azure/azure-monitor/app/java-get-started#performance-counters. You will need an ApplicationInsights.XML file: https://github.com/Microsoft/ApplicationInsights-Java/wiki/ApplicationInsights.XML. You probably need to upload this to DBFS and then copy in the appinsights_logging_init.sh to the cluster. I have not yet tested this setup.


