Some tkinter extensions that allow you to build GUI apps with modern UI/UX design concepts.
import ttkbootstrap as ttk
import tkinter_extensions as te
root = ttk.Window(title='Book (Root)',
themename='morph',
position=(100, 100),
size=(800, 500))
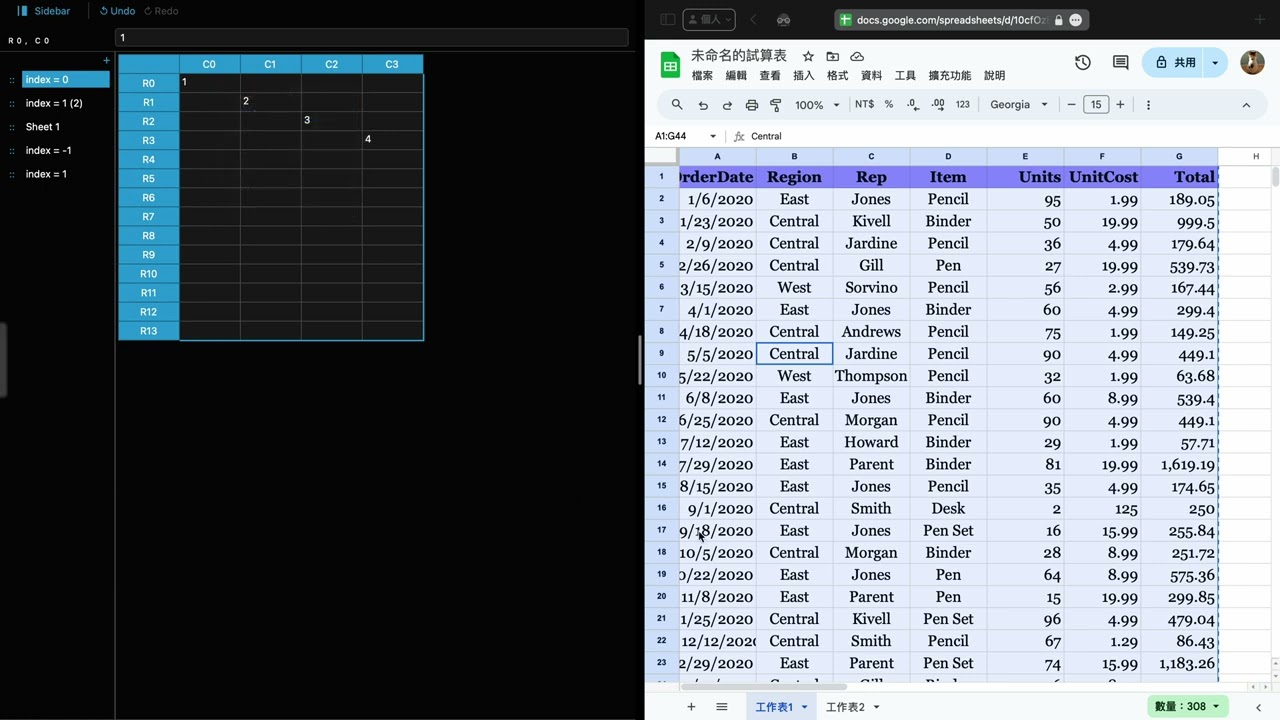
book = te.widgets.Book(root, bootstyle_scrollbar='round-light')
book.pack(fill='both', expand=1)
book.insert_sheet(1, name='index = 1')
book.insert_sheet(0, name='index = 0')
book.insert_sheet(1, name='index = 1')
book.insert_sheet(-1, name='index = -1')
book.after(3000, lambda: root.style.theme_use('minty'))
book.after(5000, lambda: root.style.theme_use('cyborg'))
root.mainloop()Click the following thumbnail to watch a demo video:
import random
import ttkbootstrap as ttk
import tkinter_extensions as te


root = ttk.Window(title='Drag and Drop', themename='cyborg')

container = te.widgets.OrderlyContainer(root)
container.pack(fill='both', expand=1)
buttons = list()
for r in range(6):
    buttons.append(list())
    for c in range(3):
        dash = '----' * random.randint(1, 5)
        button = ttk.Button(container,
                            text=f'|<{dash} ({r}, {c}) {dash}>|',
                            takefocus=True,
                            bootstyle='outline')
        buttons[-1].append(button)
container.dnd_put(buttons,
                  sticky='nse',
                  expand=True,
                  padding=10,
                  ipadding=6)

root.place_window_center()
root.mainloop()
Click the following thumbnail to watch a demo video:

import numpy as np
import ttkbootstrap as ttk
import tkinter_extensions as te
import matplotlib.pyplot as plt
root = ttk.Window(
title='Embedding in Ttk', themename='cyborg', size=[500, 500])
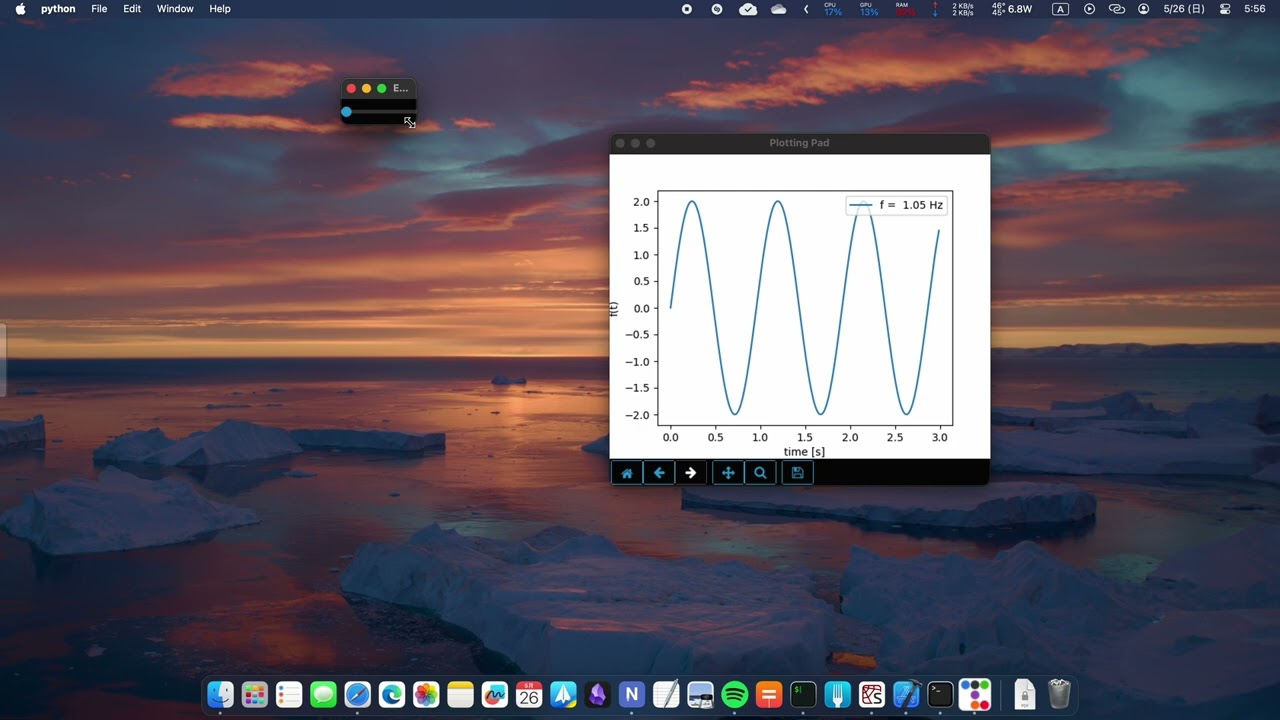
t = np.arange(0, 3, .01)
x = 2 * np.sin(2 * np.pi * 1 * t)
fig = plt.Figure(figsize=(5, 4), dpi=100)
ax = fig.subplots()
line, = ax.plot(t, x, label='f = 1 Hz')
ax.set_xlabel("time [s]")
ax.set_ylabel("f(t)")
ax.legend(loc='upper right')
plotter = te.widgets.BasePlotter(root, fig)
plotter.pack(side='top', fill='both', expand=1)
def _update_frequency(new_val):
f = float(new_val)
# update data
y = 2 * np.sin(2 * np.pi * f * t)
line.set_ydata(y)
line.set_label(f'f = {f: .2f} Hz')
ax.legend(loc='upper right')
plotter.figcanvas.draw_idle() # update canvas
slider = ttk.Scale(root,
from_=1,
to=5,
orient='horizontal',
command=_update_frequency)
slider.pack(side='bottom', pady=10)
root.mainloop()Click the following thumbnail to watch a demo video:
pip install https://github.com/TsaiTung-Chen/tkinter-extensions/archive/refs/tags/latest.zip