PieChart hides label when data is unevenly distributed #172
Description
Hi,
I am seeing what looks to be an error when the data used for a pie chart is heavy/skewed towards one particular category. The error is that the label for categories with fewer items in them are hidden. Example, a chart with categories containing [{ x: "example label", y: 1}, { x: "example label 2", y: 1 }, { x: "example label 3", y: 20 }, {...} ] will hide the labels for those with a y of 1. Increasing the size of the SVG does not seem to affect this in any way; only the relative distribution of the y values makes any difference to the labels appearing or not.
Ex,
vs

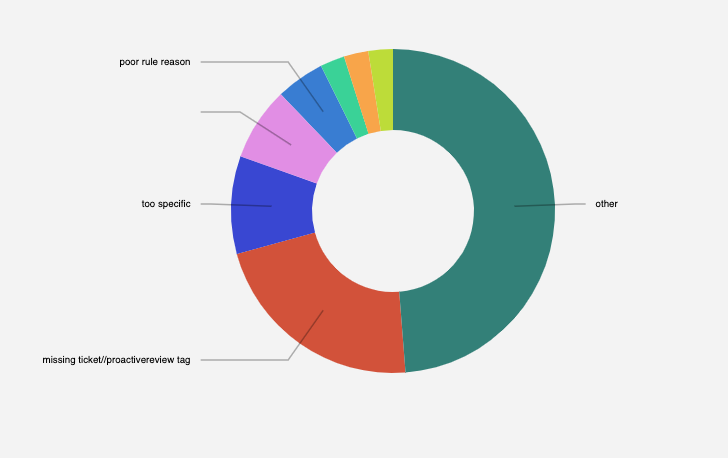
The way the data appears when the error is occurring looks like this:

A fix or some guidance would be greatly appreciated.