给你一个二维整数数组 stockPrices ,其中 stockPrices[i] = [dayi, pricei] 表示股票在 dayi 的价格为 pricei 。折线图 是一个二维平面上的若干个点组成的图,横坐标表示日期,纵坐标表示价格,折线图由相邻的点连接而成。比方说下图是一个例子:
请你返回要表示一个折线图所需要的 最少线段数 。
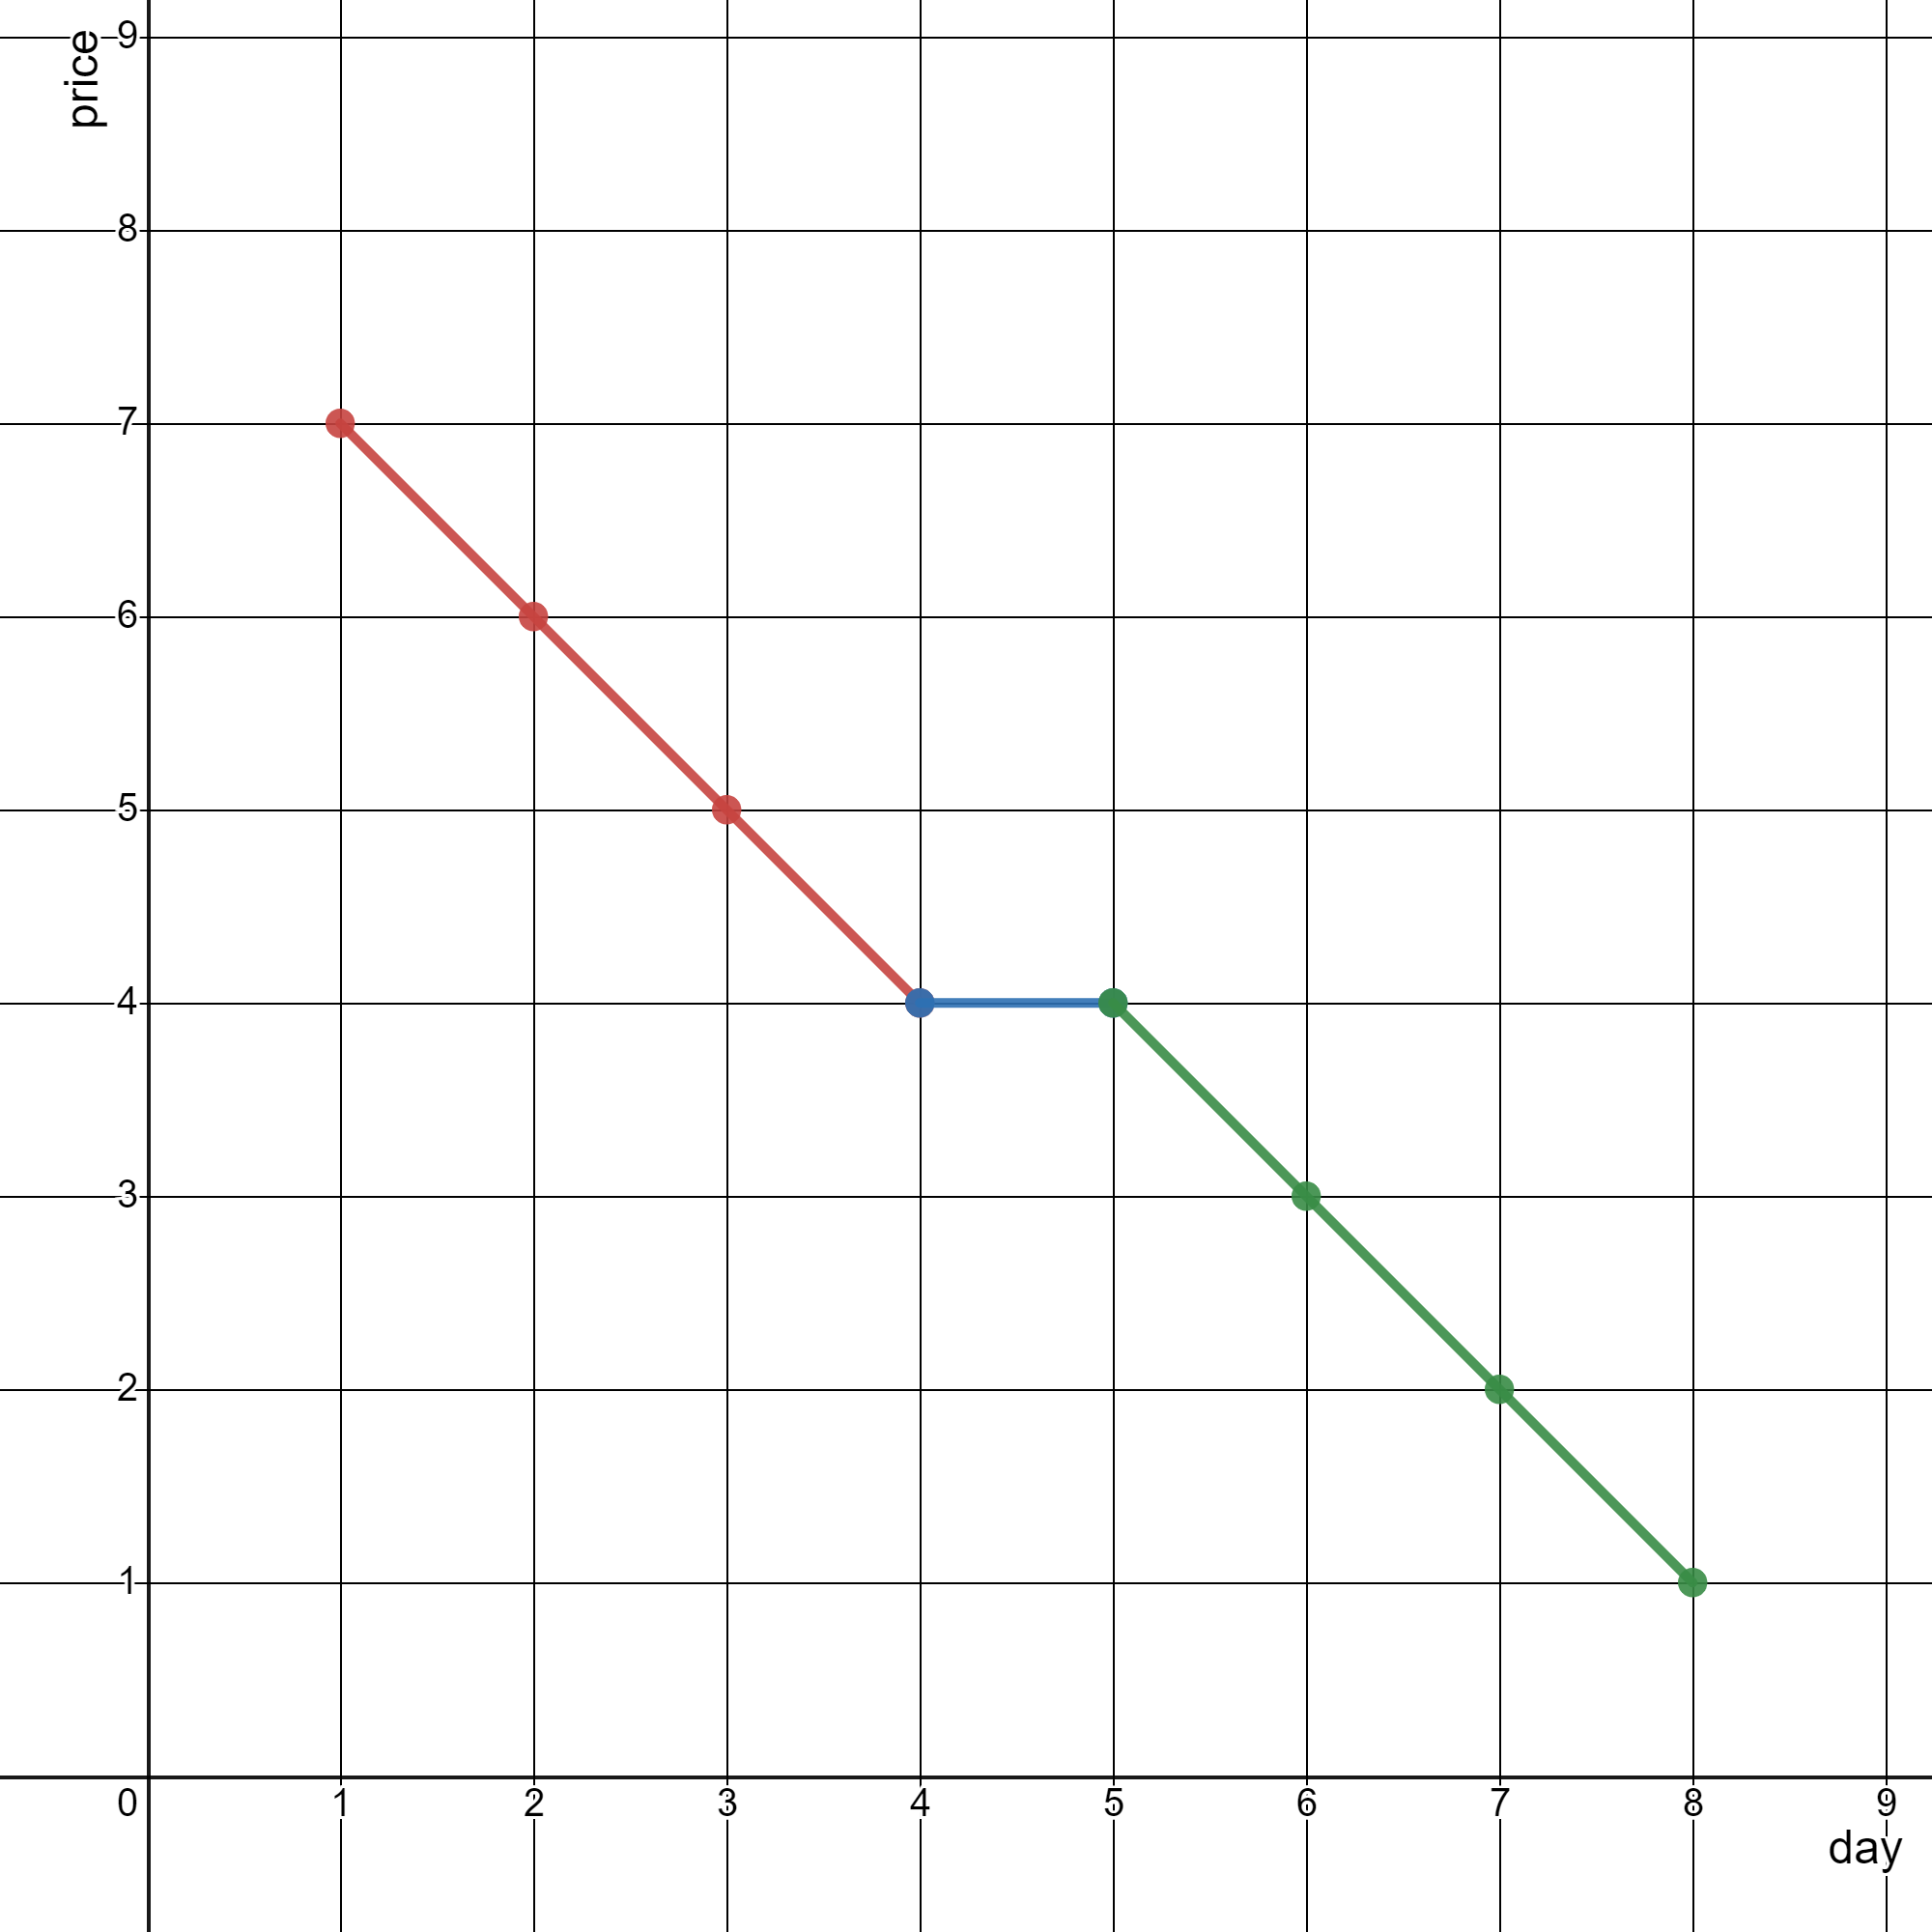
输入: stockPrices = [[1,7],[2,6],[3,5],[4,4],[5,4],[6,3],[7,2],[8,1]]
输出: 3
解释:
上图为输入对应的图,横坐标表示日期,纵坐标表示价格。
以下 3 个线段可以表示折线图:
- 线段 1 (红色)从 (1,7) 到 (4,4) ,经过 (1,7) ,(2,6) ,(3,5) 和 (4,4) 。
- 线段 2 (蓝色)从 (4,4) 到 (5,4) 。
- 线段 3 (绿色)从 (5,4) 到 (8,1) ,经过 (5,4) ,(6,3) ,(7,2) 和 (8,1) 。
可以证明,无法用少于 3 条线段表示这个折线图。
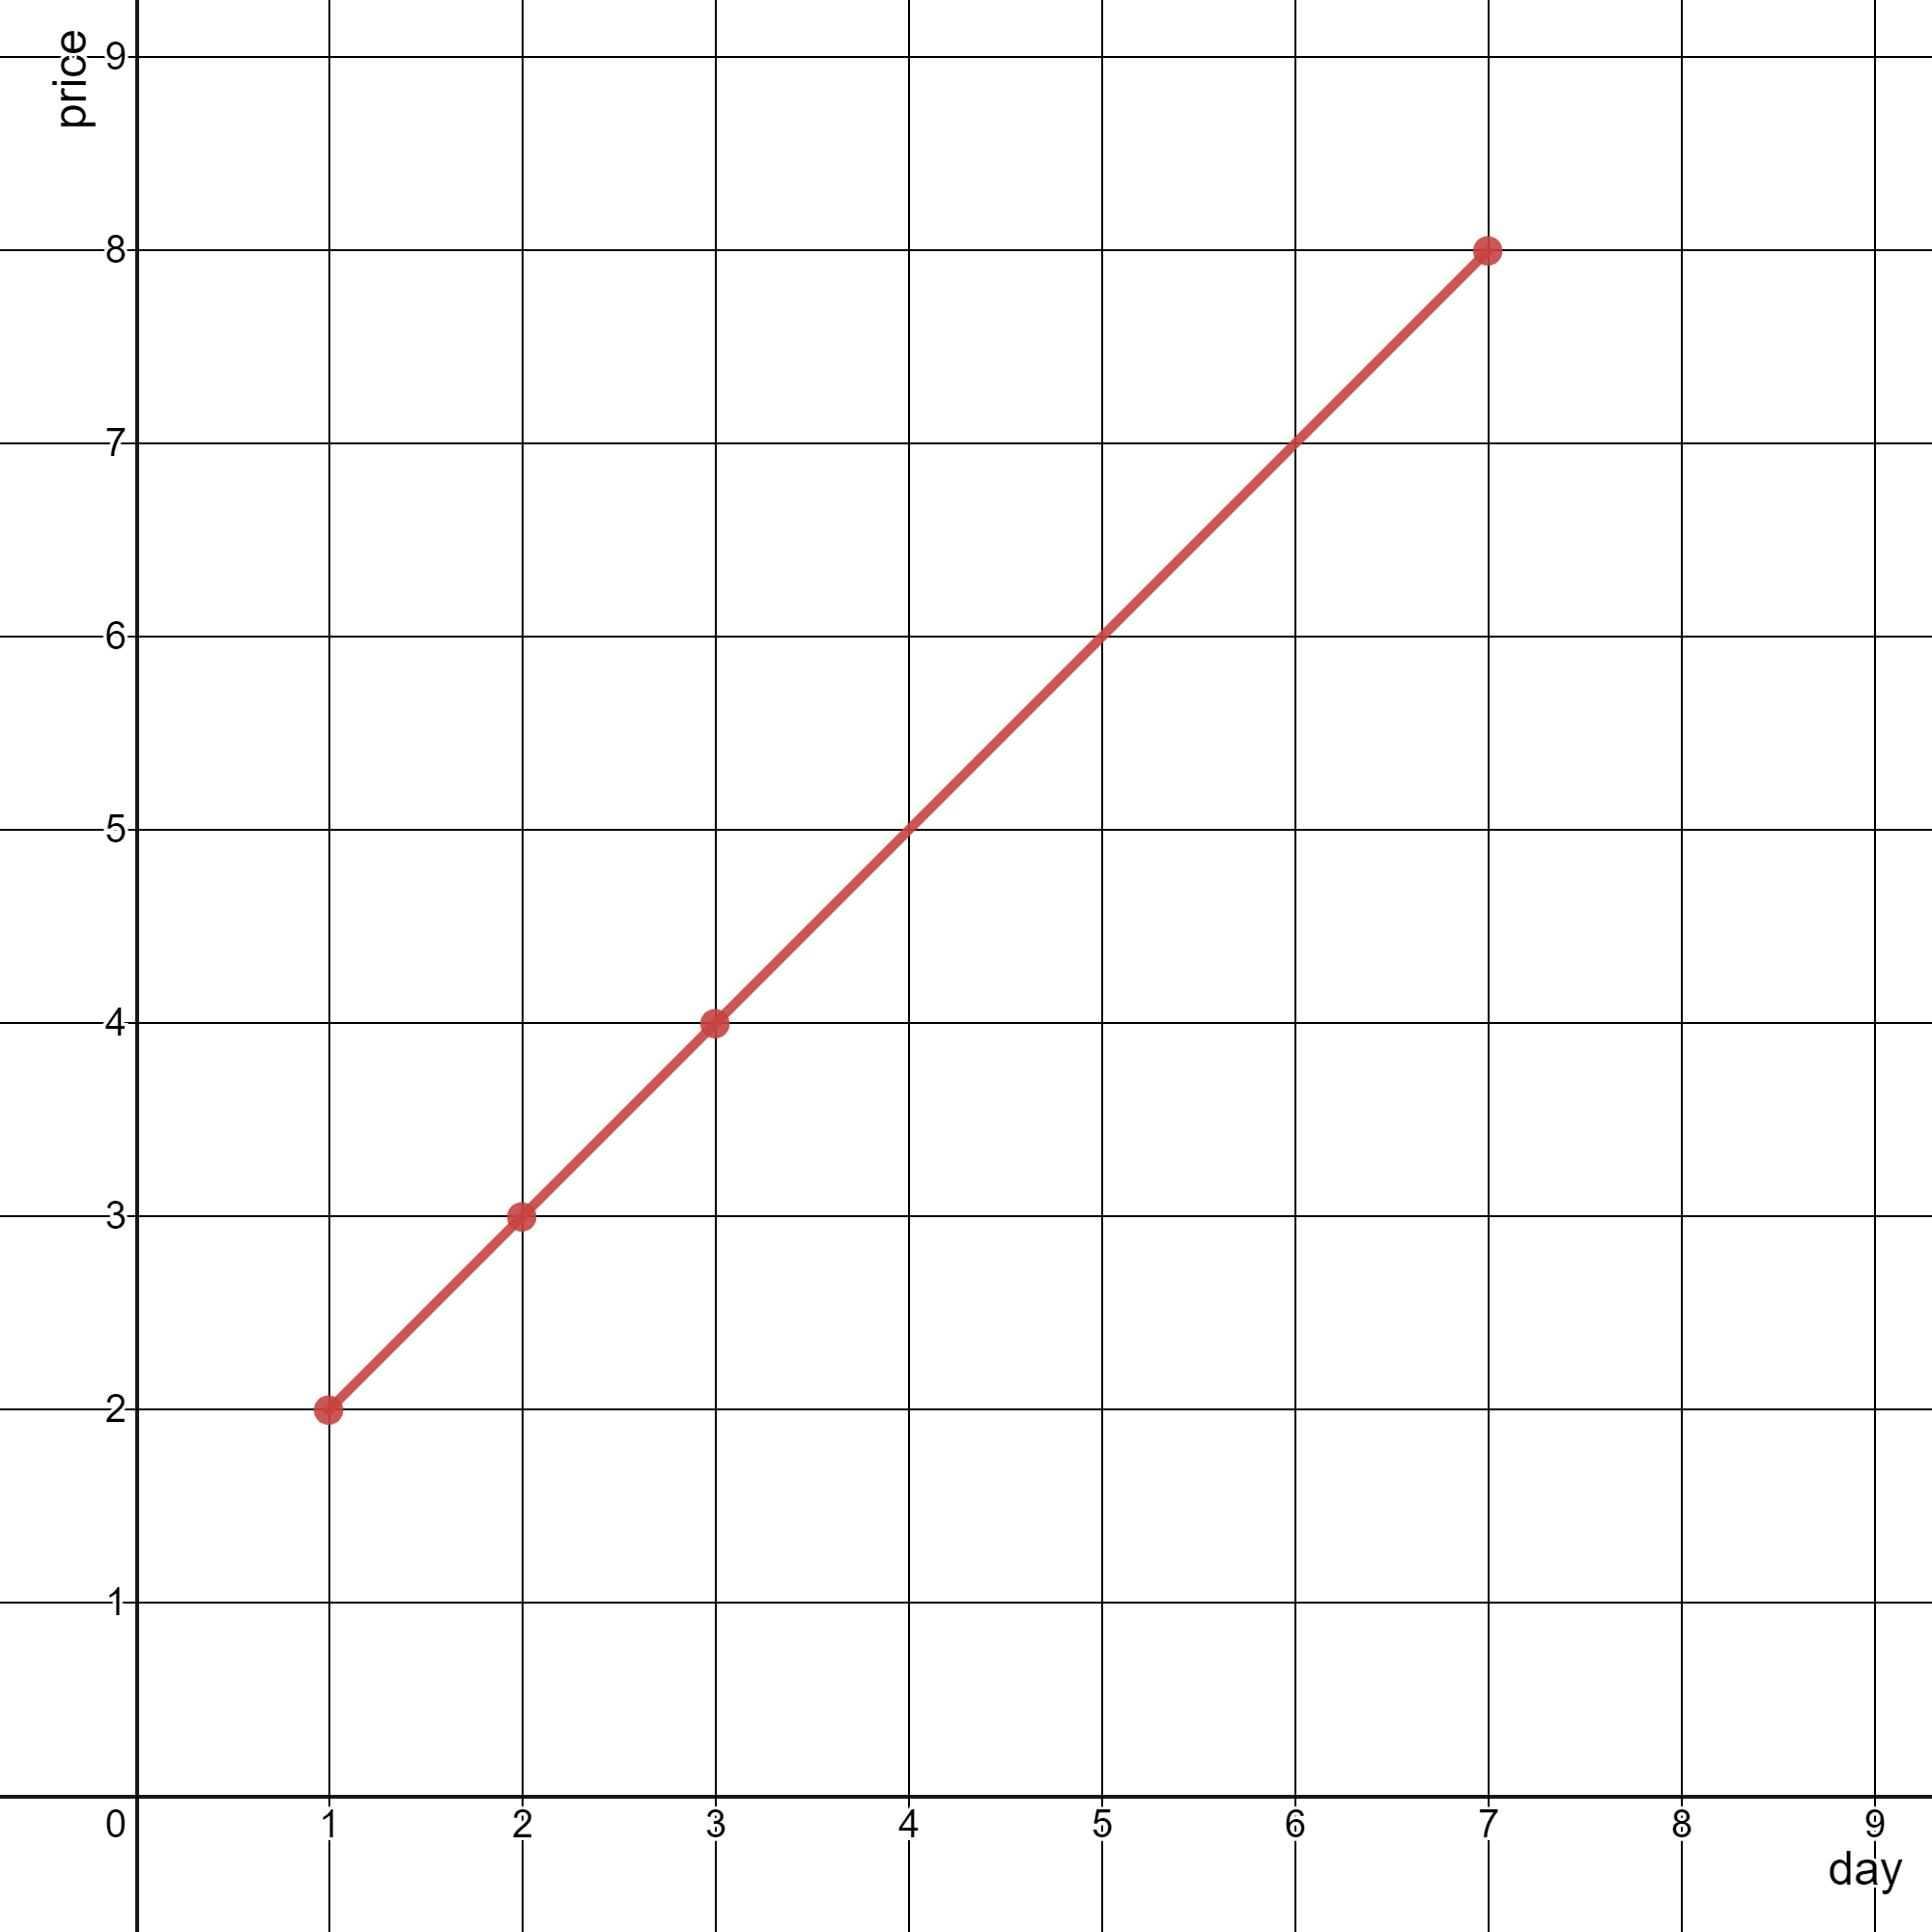
输入: stockPrices = [[3,4],[1,2],[7,8],[2,3]]
输出: 1
解释:
如上图所示,折线图可以用一条线段表示。
1 <= stockPrices.length <= 105stockPrices[i].length == 21 <= dayi, pricei <= 109- 所有
dayi互不相同 。
impl Solution {
    pub fn minimum_lines(stock_prices: Vec<Vec<i32>>) -> i32 {
        let mut stock_prices = stock_prices;
        let mut ret = (stock_prices.len() > 1) as i32;

        stock_prices.sort_unstable();

        for i in 1..stock_prices.len() - 1 {
            let (x0, y0) = (stock_prices[i - 1][0] as i64, stock_prices[i - 1][1] as i64);
            let (x1, y1) = (stock_prices[i][0] as i64, stock_prices[i][1] as i64);
            let (x2, y2) = (stock_prices[i + 1][0] as i64, stock_prices[i + 1][1] as i64);

            ret += ((y1 - y0) * (x2 - x1) != (y2 - y1) * (x1 - x0)) as i32;
        }

        ret
    }
}