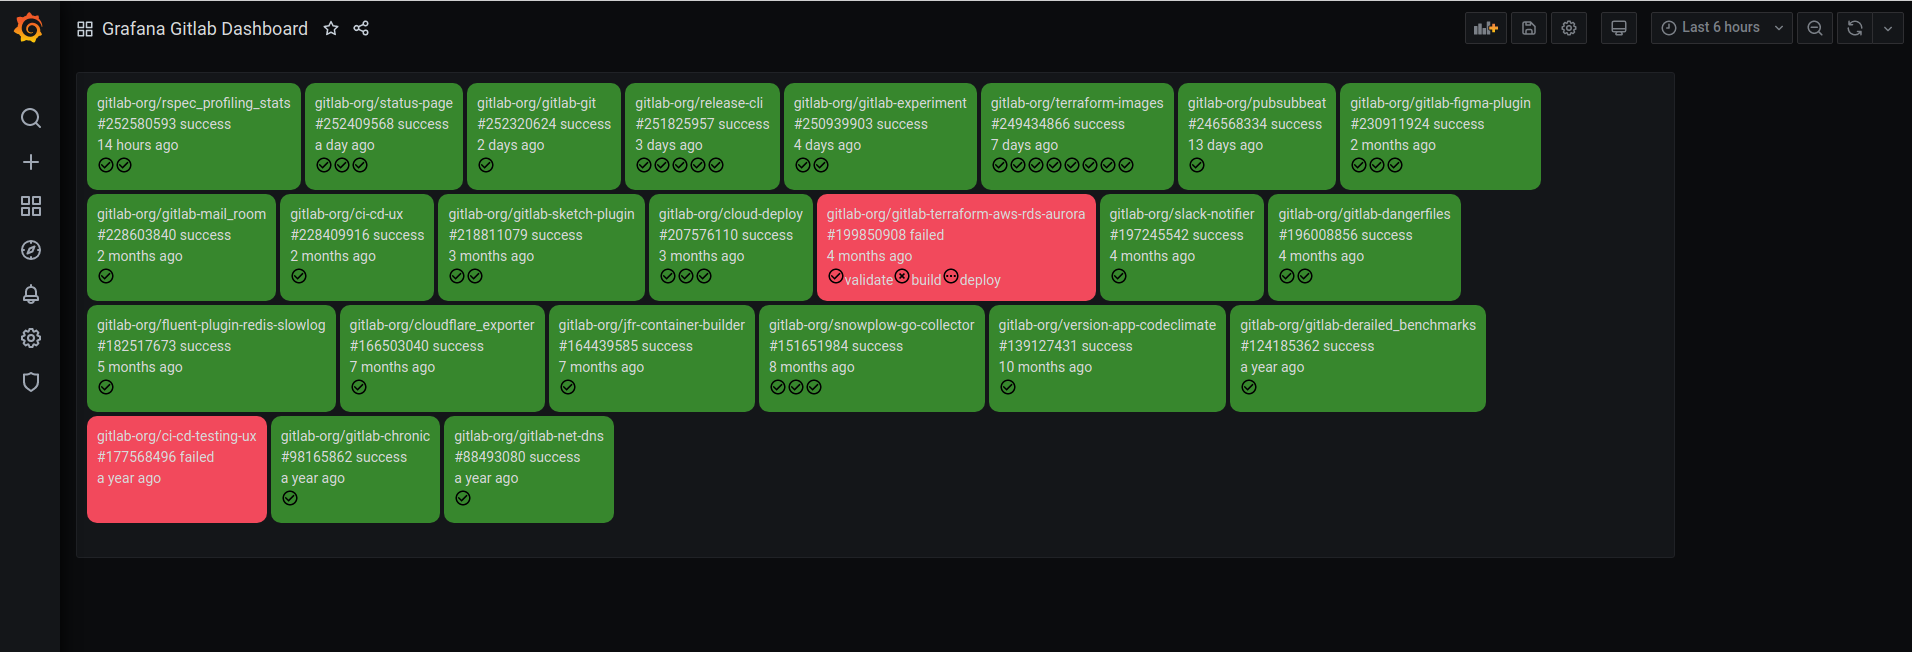
This plugin creates a datasource and a panel to visualize GitlabCI pipeline status in Grafana.
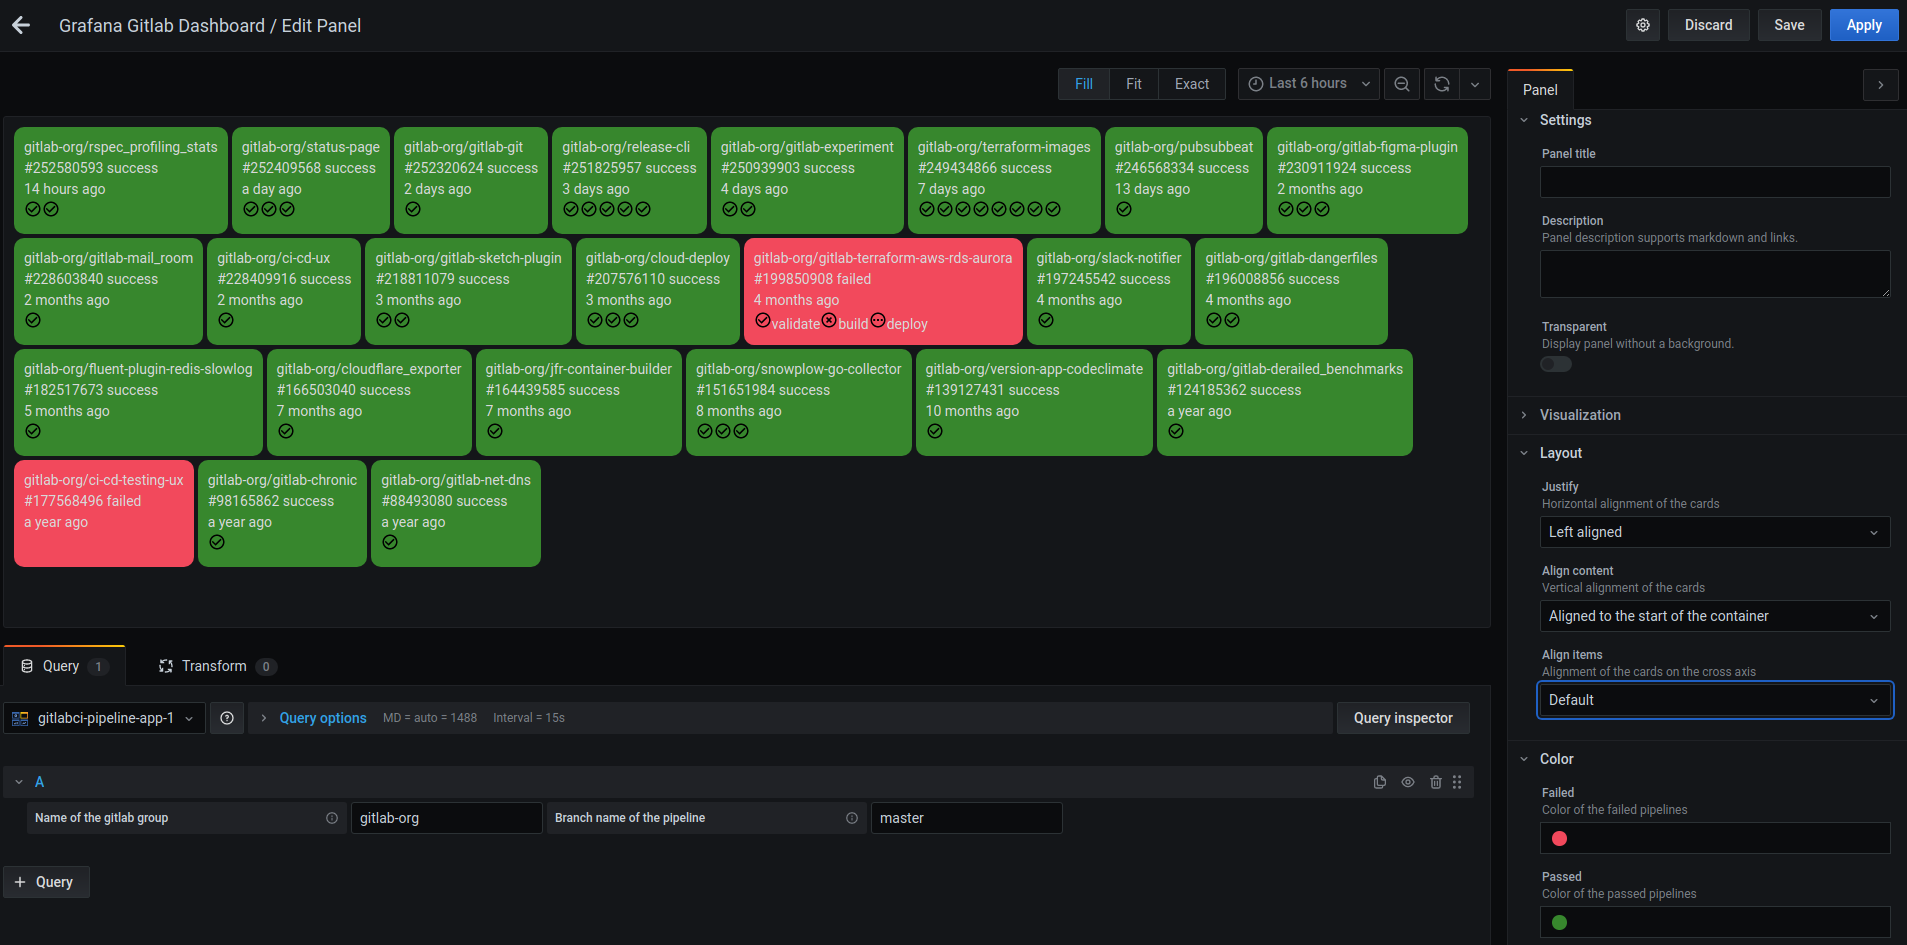
I had problems with the existing GitlabCI Pipeline dashboards, they displayed too many branches for each project, required yet another thing to deploy, so I thought why not do it in Grafana. This is the first (well 2nd) iteration, the visualization is limited, you can create queries with a gitlab group and a branch name.
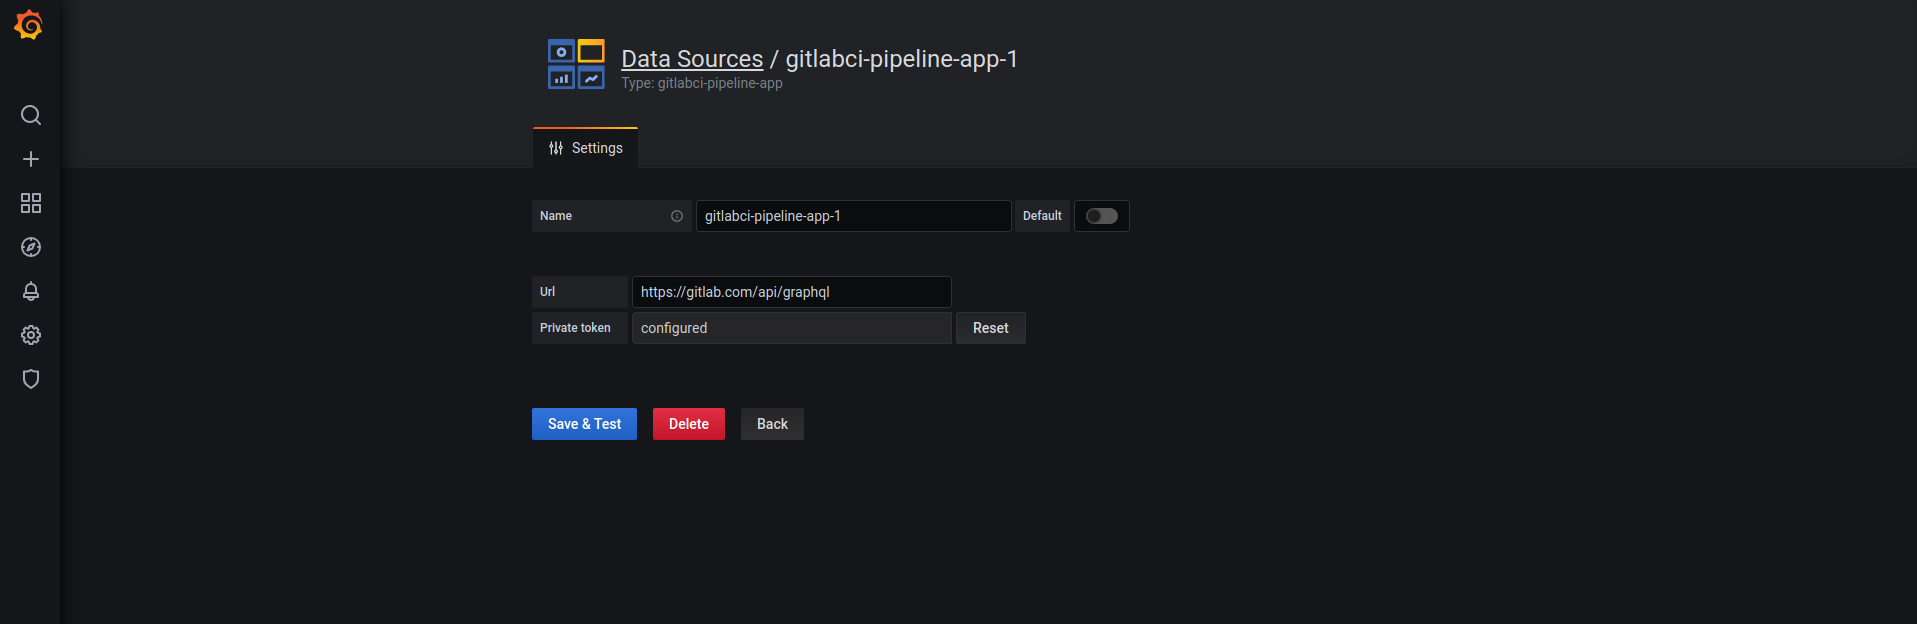
Note: to see the datasource plugin you need to enable the plugin in the plugins page, after installation.