Computer science: Add new graphs project #29037
Conversation
9f0364e to
839247a
Compare
|
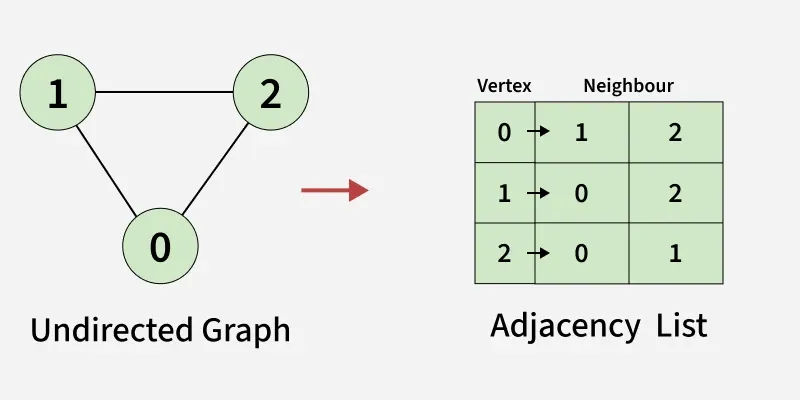
@damon314159 Thanks for making this PR! My initial impression of this is good. I did wonder why you ask for an adjacency matrix over an adjacency list? A list would be more convenient (or equivalently convenient) for nearly every operation, and I suspect learners who've been formally exposed to this will bring that up. |
It wasn't a decision I put a lot of weight on. I mostly went with a matrix so that it was easily displayable. I don't object to switching to a list approach, but it does increase the complexity of the visualisation |
|
Visualization is a good point, and I think some of the inconveniences with adding and removing vertices and edges make for good practice with keeping state held between multiple structures in-sync. I could probably be onboard for a matrix, but I think it could be good to potentially talk a bit more about a list and maybe recommend using that in Knight Travails? |
|
Sorry I left this hanging for so long! I completely forgot about it. |
|
Sorry for taking a bit to look back at this @damon314159 I'm still potentially interested in including this, but I want to discuss some things with the team first. I'm a bit wary on the scope of the project gauntlet of Linked List > Hash Map > Binary Search Tree > Knight Travails, and this will be another project to add to that bit. But I also think expanding the quality of the graph instruction would be nice for helping with Knight Travails and giving learners a better foundation in that area. I'll get back to you after I've discussed more. |
|
Okay gonna shift my above concerns to another issue and begin reviewing this in earnest this week because I think it's a good idea. Thank you for your patience 🙌 |
 JoshDevHub
left a comment
JoshDevHub
left a comment
There was a problem hiding this comment.
This is really good I think. One of the main things to figure out would be the image. Let me know if you have any questions about that.
I think the content all makes really good sense here. I might get another, less DSA-oriented maintainer to look this over and see if it's clear from that perspective.
I'll also try to put together a solution myself over the weekend and see how it feels.
Let me know if you have any other comments/concerns @damon314159
| - In a road map, cities are vertices, and roads between them are edges | ||
| - In a computer network, devices are vertices, and connections between computers are edges | ||
|
|
||
|  |
There was a problem hiding this comment.
Feel free to draw up a concrete example here. Should be able to just throw together something simple using excalidraw.
You can find out how to add images to the curriculum through the contributing guide.
There was a problem hiding this comment.
Will get something worked out this evening

|
Hi, great work @damon314159 . Although I am not involved with this PR in any way, I was looking at it and just wanted to offer my perspective on some things I noticed. In particular, neither the project description nor the G4G article explains why one might use an adjacency list vs an adjacency matrix, and in the case of the matrix, why it is even useful to represent a graph as a matrix in the first place. This latter point about matrices also has implications regarding And moreover, unless learners have had exposure to matrices before (via calculus/linear algebra course), you can't really appreciate all the nice things that matrices can tell you about the underlying data. This is all to say that I think adjacency lists are a much more motivating representation, as one wouldn't need an intuition about matrices to actually reason about their usefulness and applicability. |
|
@scriabin-enjoyer do you have an idea how we could do some kind of visualisation for that? While not necessary I think it adds a layer of tangibility that many learners will appreciate if there is some kind of visual |
|
@damon314159 Yeah there are several options. The G4G article linked does provide a graphical representation see here. Typically (in my experience) people usually represent adjacency lists as associative arrays with the keys being the nodes of the graph and the values are arrays or linked lists containing nodes that are adjacent to the key. Such a textual representation would be imo a legitimate replacement for the 
|
Because
The concept of graphs is introduced but rather swept under the rug in the current implementation of the knight travails project
This PR
Issue
Closes #28487
Additional Information
Notes:
Pull Request Requirements
location of change: brief description of changeformat, e.g.Intro to HTML and CSS lesson: Fix link textBecausesection summarizes the reason for this PRThis PRsection has a bullet point list describing the changes in this PRIssuesection