High-performance CLI tool for exploratory data analysis of image datasets.
Scan folders of images, generate JSONL manifests with metadata and pixel statistics, detect quality issues, find duplicates, and produce publication-ready visualizations — all from the command line.


pip install imgedaOr with uv:
uv tool install imgedapip install imgeda[parquet] # Parquet export
pip install imgeda[embeddings] # CLIP embeddings + UMAP visualization (torch, open_clip)
pip install imgeda[opencv] # OpenCV-accelerated scanning# Scan a directory of images
imgeda scan ./images -o manifest.jsonl
# View dataset summary
imgeda info -m manifest.jsonl
# Check for quality issues
imgeda check all -m manifest.jsonl
# Detect blurry images
imgeda check blur -m manifest.jsonl
# Detect cross-split data leakage
imgeda check leakage -m train.jsonl -m val.jsonl
# Analyze annotations (auto-detects YOLO, COCO, VOC)
imgeda annotations ./dataset
# Generate all plots (11 plot types)
imgeda plot all -m manifest.jsonl
# Generate an HTML report
imgeda report -m manifest.jsonl
# Compare two manifests
imgeda diff --old v1.jsonl --new v2.jsonl
# Run quality gate (exit code 2 on failure — CI-friendly)
imgeda gate -m manifest.jsonl -p policy.yml
# Export to CSV or Parquet
imgeda export csv -m manifest.jsonl -o dataset.csv
imgeda export parquet -m manifest.jsonl -o dataset.parquet
# Compute CLIP embeddings with UMAP visualization (requires: pip install imgeda[embeddings])
imgeda embed -m manifest.jsonl -o embeddings.npz --plotOr just run imgeda with no arguments for an interactive wizard that walks you through everything:
# Interactive mode — auto-detects dataset format (YOLO, COCO, VOC, classification, flat)
imgeda
The wizard detects your dataset structure, shows a summary panel with image counts, splits, and class info, then lets you pick which splits and analyses to run.
- Fast parallel scanning with multi-core
ProcessPoolExecutorand Rich progress bars - Resumable — Ctrl+C anytime, progress is saved. Re-run and it picks up where it left off
- JSONL manifest — append-only, crash-tolerant, one record per image
- Per-image analysis: dimensions, file size, pixel statistics (mean/std per channel), brightness, perceptual hashing (phash + dhash), border artifact detection, blur detection (Laplacian variance), EXIF metadata (camera, lens, focal length, exposure, GPS flagging, distortion risk)
- Quality checks: corrupt files, dark/overexposed images, border artifacts, blur detection, exact and near-duplicate detection
- Cross-split leakage detection — find duplicate images across train/val/test splits using perceptual hashing
- Annotation analysis — parse and summarize YOLO, COCO, and Pascal VOC annotations with per-class statistics
- CLIP embeddings — compute image embeddings with OpenCLIP, detect outliers, find semantic near-duplicates, and visualize with UMAP (optional extra)
- 11 plot types with automatic large-dataset adaptations: dimensions, file size, aspect ratio, brightness, channels, artifacts, duplicates, blur scores, EXIF camera/focal/ISO distributions
- Single-page HTML report with embedded plots and summary tables
- Dataset format detection — auto-detects YOLO, COCO, Pascal VOC, classification, and flat image directories with split-aware scanning
- Interactive configurator with Rich panels, split selection, and smart defaults
- Lambda-compatible core — the analysis functions have zero CLI dependencies, ready for serverless deployment
- Manifest diff — compare two manifests to track dataset changes over time
- Quality gate — policy-as-code YAML rules with 11 configurable checks and CI-friendly exit codes
- CSV and Parquet export — export manifests with flattened nested fields
- AWS serverless deployment — CDK + Step Functions + Lambda for S3-scale analysis
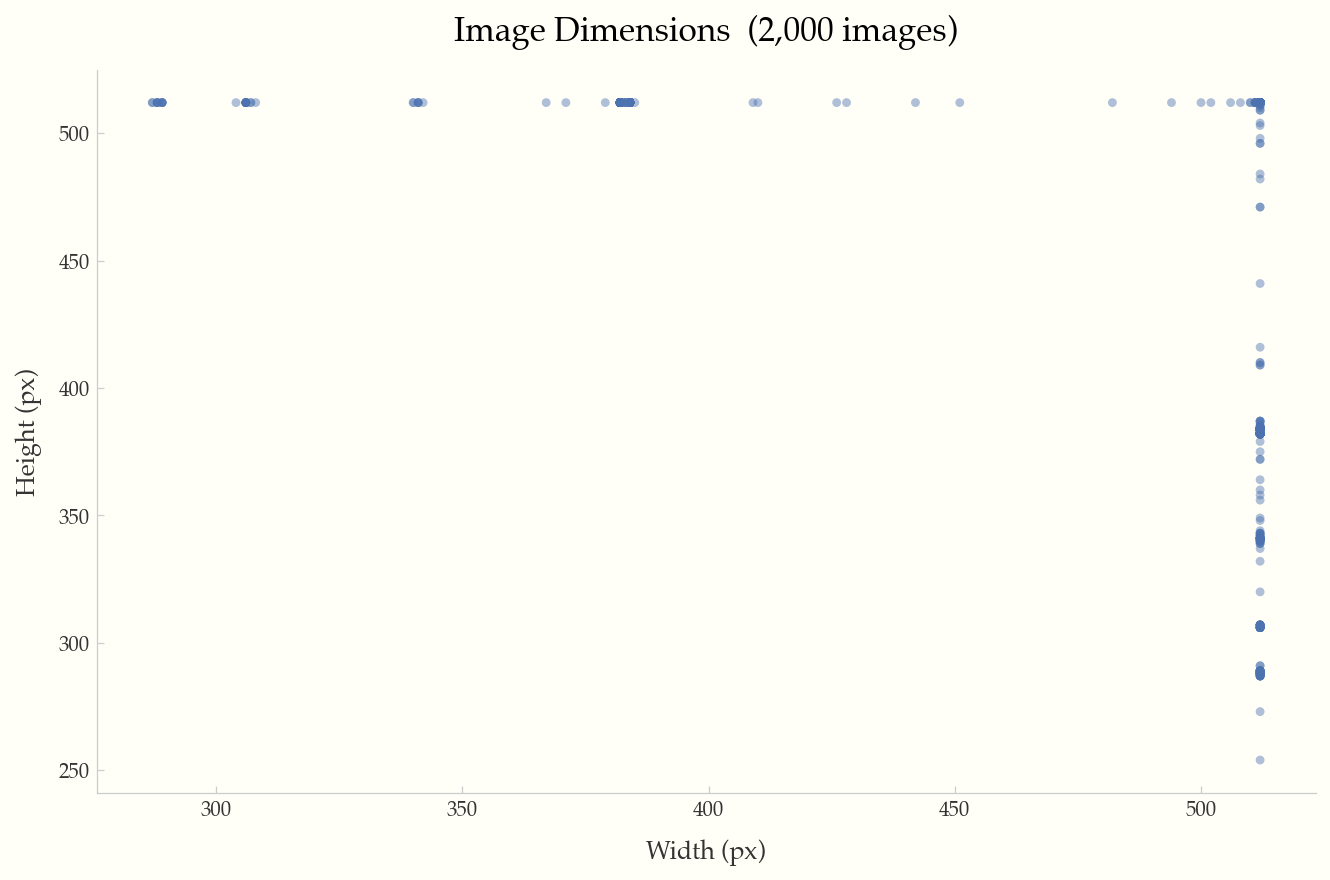
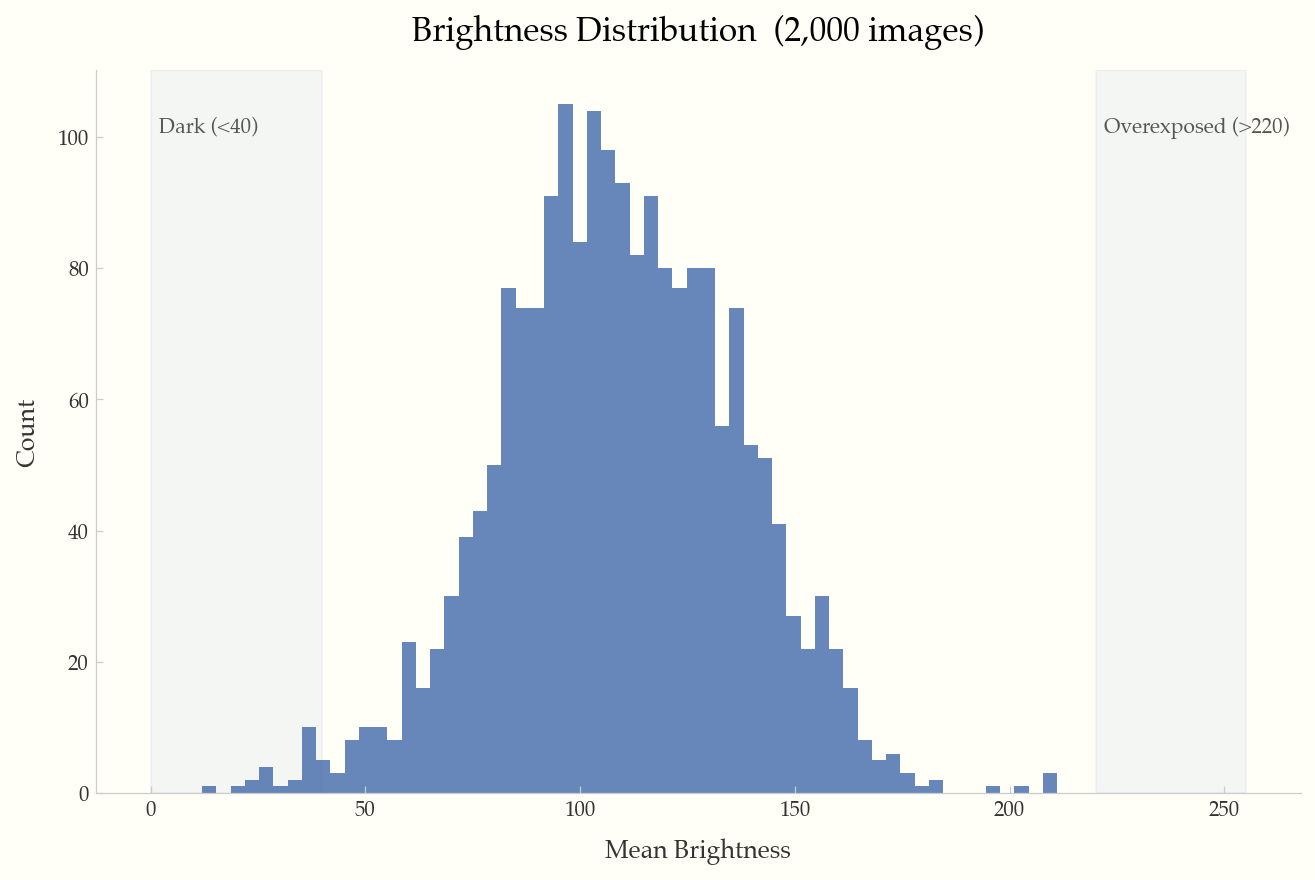
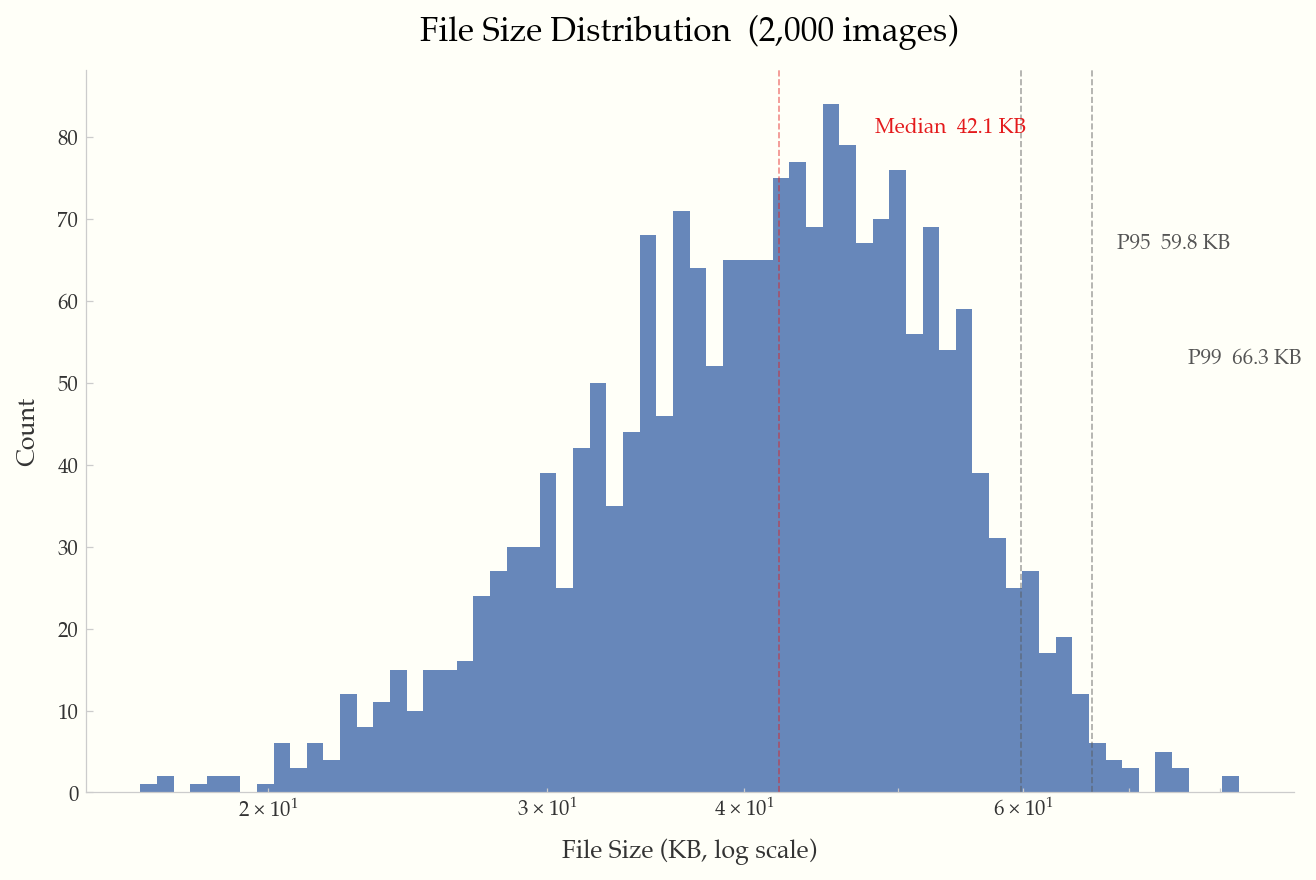
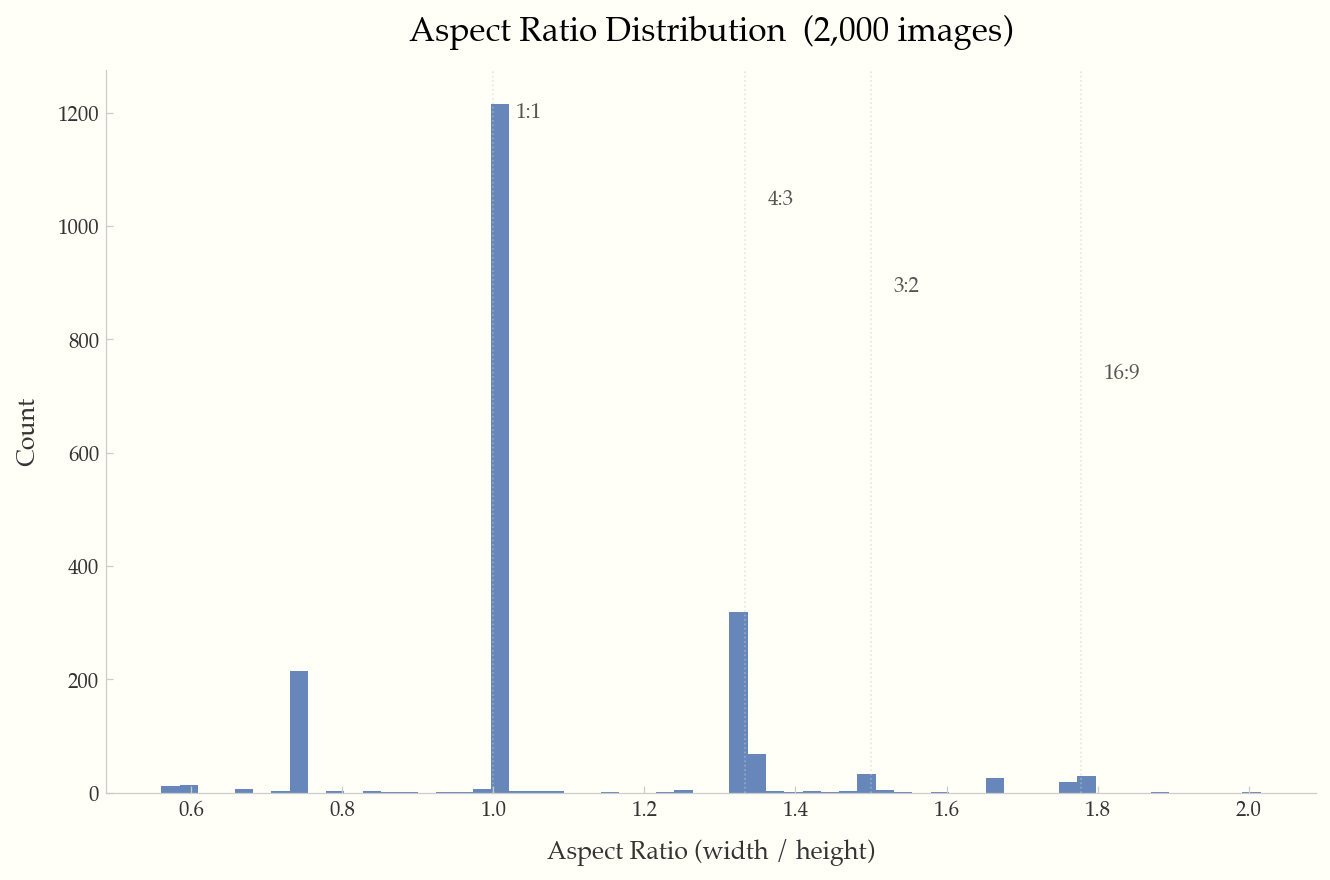
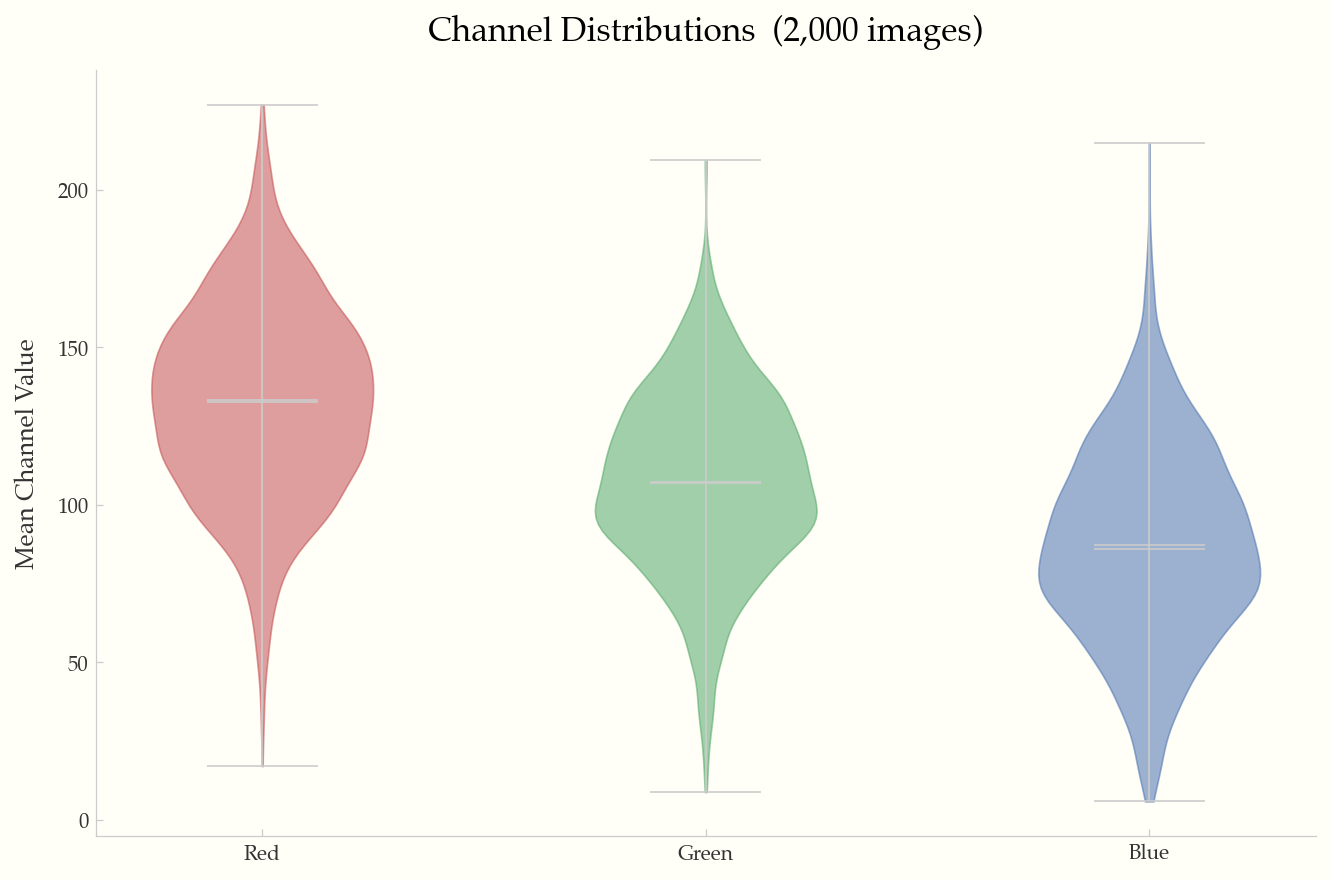
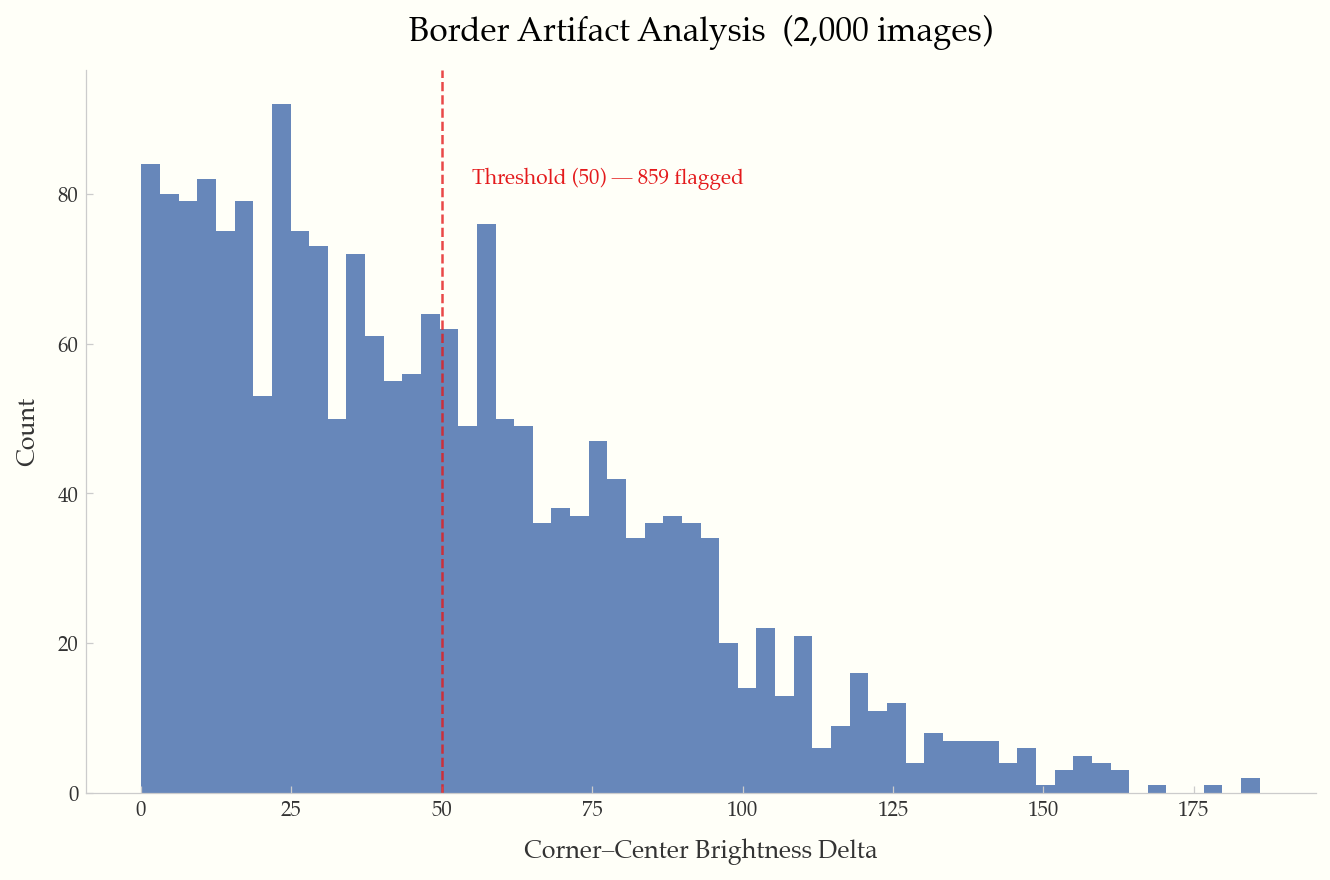
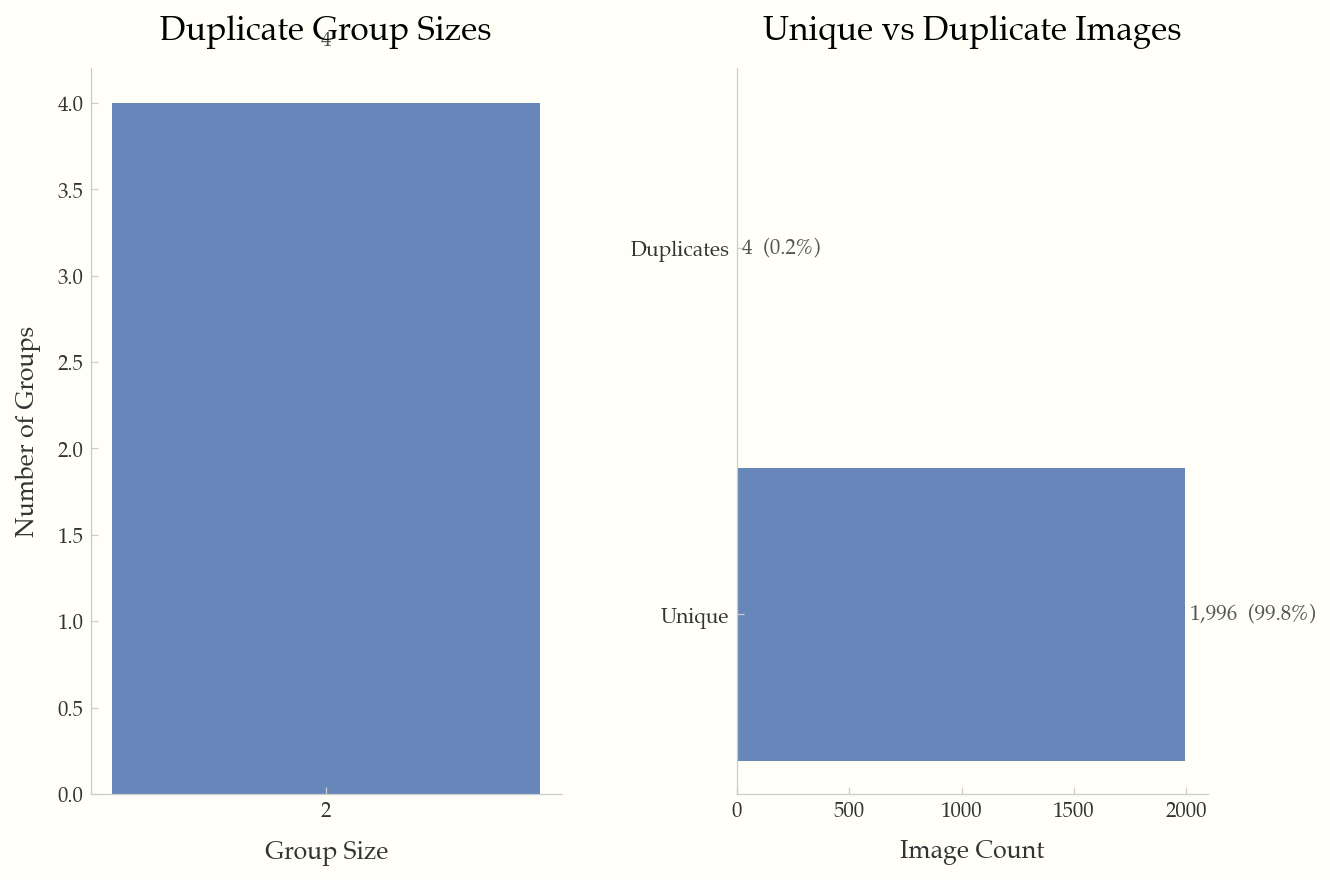
All examples below were generated from the Food-101 dataset (2,000 images).
Width vs. height scatter plot with reference lines for 720p, 1080p, and 4K resolutions.
Histogram of mean brightness per image, with shaded regions for dark (<40) and overexposed (>220) images.
Log-scale histogram with annotated median, P95, and P99 percentile lines.
Histogram with reference lines at common ratios (1:1, 4:3, 3:2, 16:9).
Violin plots of mean R/G/B channel values across the dataset.
Corner-to-center brightness delta histogram with configurable threshold line.
Duplicate group sizes and unique vs. duplicate breakdown.
Scan a directory of images and produce a JSONL manifest.
Options:
  -o, --output PATH           Output manifest path [default: imgeda_manifest.jsonl]
  --workers INTEGER           Parallel workers [default: CPU count]
  --checkpoint-every INTEGER  Flush interval [default: 500]
  --resume / --no-resume      Auto-resume from existing manifest [default: resume]
  --force                     Force full rescan (ignore existing manifest)
  --skip-pixel-stats          Metadata-only scan (faster)
  --skip-exif                 Skip EXIF metadata extraction
  --no-hashes                 Skip perceptual hashing
  --extensions TEXT            Comma-separated extensions to include
  --dark-threshold FLOAT      Dark image threshold [default: 40.0]
  --overexposed-threshold FLOAT  Overexposed threshold [default: 220.0]
  --artifact-threshold FLOAT  Border artifact threshold [default: 50.0]
  --max-image-dim INTEGER     Downsample threshold for pixel stats [default: 2048]
Print a Rich-formatted dataset summary.
Subcommands: corrupt, exposure, artifacts, duplicates, blur, all
Detect cross-split data leakage between two or more manifests using perceptual hashing.
Options:
  --threshold INTEGER   Hamming distance threshold [default: 8]
  -o, --out PATH        Output JSON path (optional)
Analyze annotations in a dataset directory. Auto-detects YOLO, COCO, and Pascal VOC formats.
Options:
  -f, --format TEXT          Force format: yolo, coco, voc (auto-detected if omitted)
  --labels PATH              YOLO labels directory
  --annotation-file PATH     COCO JSON annotation file
  -o, --out PATH             Output JSON path (optional)
Subcommands: dimensions, file-size, aspect-ratio, brightness, channels, artifacts, duplicates, blur, exif-camera, exif-focal, exif-iso, all
Common options:
  -o, --output PATH    Output directory [default: ./plots]
  --format TEXT         Output format: png, pdf, svg [default: png]
  --dpi INTEGER         DPI for output [default: 150]
  --sample INTEGER      Sample N records for large datasets
Generate a single-page HTML report with embedded plots and statistics.
Compare two manifests and show added, removed, and changed images with field-level diffs.
Options:
  -o, --out PATH    Output JSON path (optional)
Evaluate a manifest against a YAML quality policy. Exit code 0 = pass, 2 = fail.
Options:
  -o, --out PATH    Output JSON path (optional)
Example policy (policy.yml):
min_images_total: 100
max_corrupt_pct: 1.0
max_overexposed_pct: 5.0
max_underexposed_pct: 5.0
max_duplicate_pct: 10.0
max_blurry_pct: 10.0
max_artifact_pct: 5.0
min_width: 224
min_height: 224
max_aspect_ratio: 3.0
allowed_formats: [jpeg, png]Export manifest to CSV with flattened nested fields.
Export manifest to Parquet format with flattened nested fields. Requires pip install imgeda[parquet].
Compute CLIP image embeddings, detect outliers, and generate a UMAP scatter plot. Requires pip install imgeda[embeddings].
Options:
  -o, --out PATH             Output .npz file [default: ./embeddings.npz]
  --model TEXT               OpenCLIP model name [default: ViT-B-32]
  --pretrained TEXT          Pretrained weights [default: laion2b_s34b_b79k]
  --batch-size INTEGER       Inference batch size [default: 32]
  --device TEXT              Torch device (auto-detected)
  --plot / --no-plot         Generate UMAP plot [default: --plot]
  --plot-dir PATH            Plot output directory [default: ./plots]
See docs/architecture.md for detailed system diagrams including the local CLI flow, AWS serverless flow, CI/CD quality gate flow, and full module dependency graph.
The manifest is a JSONL file (one JSON object per line):
- Line 1: Metadata header (input directory, scan settings, schema version)
- Lines 2+: One
ImageRecordper image with all computed fields
{"__manifest_meta__": true, "input_dir": "./images", "created_at": "2026-02-17T12:00:00", ...}
{"path": "./images/cat.jpg", "width": 500, "height": 375, "format": "JPEG", "camera_make": "Canon", "focal_length_35mm": 50, "distortion_risk": "low", "has_gps_data": false, "phash": "a1b2c3d4", ...}
The manifest is append-only and crash-tolerant. Resume is keyed on (path, file_size, mtime) — modified files are automatically re-analyzed.
Tested on a 10-core Apple M1 Pro with SSD:
| Operation | 3,680 images |
|---|---|
| Full scan (metadata + pixels + hashes) | ~8s |
| Plot generation | ~3s |
| HTML report | ~4s |
The tool is designed to handle 100K+ image datasets with batched processing, memory-bounded futures, and automatic plot adaptations for large datasets.
git clone https://github.com/caylent/imgeda.git
cd imgeda
uv sync --extra dev --extra parquet --extra opencv
uv run pytest
uv run ruff check src/ tests/
uv run mypy src/MIT