Navigation
The navigation panel provides a high level overview of the Spreadsheet. When the user chooses to explore the data by a specific attribute, an overview is constructed and displayed within the navigation panel, next to the raw spreadsheet data. The overview is essentially a histogram and depicts the overall data distribution for the chosen attribute, enabling users to quickly assimilate the data. Cumbersome scrolling operations are eliminated in favor of a few clicks of the overview interface. Users can issue aggregation operations on the overview and view results on a separate aggregate column, alongside the overview. The system automatically creates contextual and historical information while displaying visual cues so that users don't lose context during navigation.

The navigation panel is hidden by default. After either importing or loading a spreadsheet, users can choose to display the navigation panel by checking Nav->Explore. The navigation panel consists of (a) a zoomable overview and (b) an aggregate column integrated with (c) a spreadsheet. A conext bar consisting of (d) navigation history displaying locations visited so far using the overview, and (e) breadcrumb showing the current navigation path. (f) User’s current focus in the spreadsheet is highlighted on the overview. (g) Columns corresponding to the navigation attribute (city) and aggregate column (availability) are highlighted on the spreadsheet.

The Navigation Panel.
Please click on the following links to explore the features in detail:
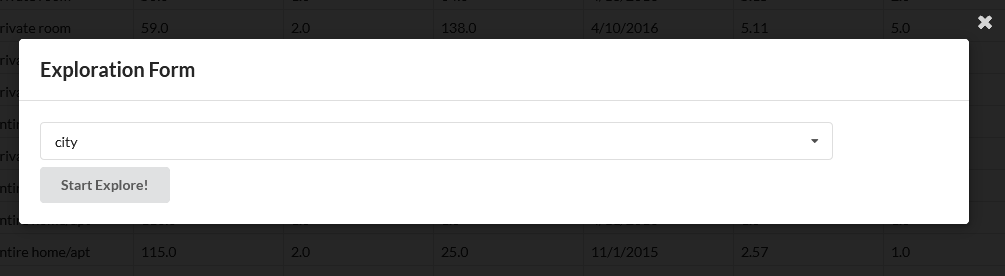
Step 1: From the menubar select Nav -> Explore.

Step 2: Select the attribute by which you want to explore the data.
- The navigation feature only works for tabular data, currently.
- The first row of the table is the header.
- All the computation is in memory and one shot. Therefore, larger the spreadsheet increases the construction time for the navigation panel.