A powerful, real-time Nginx log analyzer with a focus on security intelligence, performance monitoring, and beautiful data visualization. Powered by the IP2Location API.
BitCurrents Analyzer turns raw Nginx logs into actionable insights. It moves beyond simple IP lookups to provide a rich, interactive dashboard that helps you understand your traffic, identify security threats, and diagnose server errors instantly. It's extremely lightweight as single-page web application, built with a Python/Flask backend and dynamic JavaScript frontend, private, nimble, customizable.
Follow link, List Button, select file, Analyze Button, wait..., peruse all the things ;)
Switch between three distinct analysis modes, each with a purpose-built dashboard:
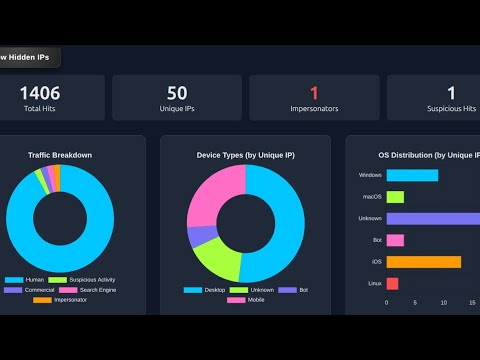
Your command center for at-a-glance traffic overview.
- Rich KPI Cards: Total Hits, Unique IPs, and critical counts of Impersonator and Suspicious traffic.
- Comprehensive Charting:
- Traffic Breakdown (Human, Bots, Crawlers)
- Device Types (Desktop, Mobile)
- OS & Browser Distribution
- HTTP Status Code Distribution
- Top Countries & Top Successful Pages
- Powerful Filtering: Instantly hide noisy IPs to see the real signal, and switch between analyzing Unique IPs vs. All Hits.

Proactively hunt for threats and analyze attack patterns.
- Dynamic Threat Categories: Filter logs for specific attack vectors like Config Exposure, Webshells, and WordPress probes using a configurable
security_patterns.json. - Targeted Visualizations: See charts for Top Attack Categories and Top Attacking IPs.
- Bot Impersonator Detection: Automatically flags traffic pretending to be a legitimate crawler from an unverified IP address.

Quickly diagnose and understand server problems.
- Smart Error Parsing: Intelligently categorizes common Nginx
error.logmessages (e.g., "Backend Unreachable," "Index Forbidden"). - Insightful Charts: Visualize error types and severity levels to prioritize fixes.
- In-App Quick Guide: A helpful "Error Log Tips" modal provides context and troubleshooting advice for common Nginx errors.

This project leverages the power and precision of the IP2Location.io API to deliver advanced security features, including:
- High-Fidelity Geolocation: Pinpointing the source of traffic with country, city, and ISP data.
- Intelligent Bot Detection: Moving beyond simple user-agent strings.
- Bot Impersonator Flagging: A critical security feature that verifies if traffic claiming to be from major crawlers (like Googlebot) is actually coming from their published IP ranges.
Clone this repository.
-
Install pyenv: If you don't have it, follow the installation guide. For macOS/Linux with Homebrew, it looks like this:
`brew install pyenv`
Make sure to follow the post-install instructions to add pyenv init to your shell's startup script (.zshrc, .profile, .bashrc, etc.).
Then add these lines to your shell config (~/.bashrc or ~/.zshrc):
```
export PATH="$HOME/.pyenv/bin:$PATH"
eval "$(pyenv init -)"
eval "$(pyenv virtualenv-init -)"
```
Restart your shell so changes take effect.
-
Install a Python Version: Let's use a recent, stable version.
`pyenv install 3.13.0` -
Create Your Project:
`git clone https://github.com/deadflowers/bitcurrents-log-analyzer` `cd bitcurrents-log-analyzer` -
Set the Local Python Version: This command creates a .python-version file in your directory, so pyenv automatically uses this version whenever you're in this folder.
`pyenv local 3.13.0` -
Create & Activate a Virtual Environment: This is a best practice within your pyenv version to keep packages project-specific.
Create the virtual environment folder named 'venv'
python -m venv .venvActivate it
source .venv/bin/activateYour terminal prompt should have in it
(.venv) -
Install Dependencies:
`pip install -r requirements.txt` -
Set Up API Key:
-
Sign up for a free account at IP2Location.io to get an API key. The free plan is quite capable.
-
Create a file named .env in your project directory and add your key:
IP2LOCATION_API_KEY=your-keyor
export IP2LOCATION_API_KEY=your-key
-
Make sure your .venv is activated.
-
Run it: In your terminal, inside the bitcurrents-log-analyzer directory, start the backend, and the front end
source .venv/bin/activate
python app.pyOpen index.html in your web browser as file:/// path
The dashboard will load with the new dark theme.
- Enter the directory where your logs are stored or copied to. Default is
. - Hit "List" button to see log files in that directory
- Optionally, enter a path fragment to track in the "Track Custom Path"
- Click the "Analyze Logs" button and wait a moment.
You can use sample logs provided in './sample_logs' in the project folder, where you will find combined.log. Just entr . as directory to search logs then choose in the next area specific file combined.log
The charts will populate, and the detailed IP table will appear below. You can now distinguish OS/Bot and any suspicious paths hit directly in the table.
- Add new paths to your watchlist on-the-fly using the "Add to Suspicious List" feature.
Being conservative with credits we keep an ip cache file as well automatically.
combined.log is a quick dump of nginx access logs. It is provided in the app as data to test. If you are not having luck when running your own, check your nginx config:
To display the referrer in Nginx access logs, ensure your log_format configuration includes the $http_referer variable.
I have in my nginx.conf the following:
# Logging
    log_format custom_format '$remote_addr - $remote_user [$time_local] '
                          '"$request" $status $body_bytes_sent '
                          '"$http_referer" "$http_user_agent"';
    access_log		      /var/log/nginx/access.log custom_format;
    error_log              /var/log/nginx/error.log warn;
Then in my domain conf:
# logging
    access_log              /var/log/nginx/site.com.access.log custom_format buffer=512k flush=1m;
    error_log               /var/log/nginx/site.com.error.log warn;
Reload
sudo systemctl reload nginx
Thanks for checking it out, let me know what you think. We look forward to future iterations and new features.
#IP2LocationContest #ProgrammingContest
Log Analyzer concept by Ray Kooyenga
@deadflowers @rkooyenga