
Degradation Usage Meter Bar — a context rot indicator for Pi
Shows your current token usage in the status bar with research-backed color warnings for when your LLM is getting dumber.
LLM quality degrades based on absolute token count, not context window percentage. A 200k-window model at 100k tokens performs just as poorly as a 1M-window model at 100k tokens.
Research:
- Chroma (2025): All 18 frontier models degrade as context grows
- Liu et al. (Stanford): 30%+ accuracy drop from "lost-in-the-middle" effect
- Attention dilution is quadratic: 100k tokens = 10 billion pairwise relationships
| Icon | Tokens | Zone | Meaning |
|---|---|---|---|
| 🧠 | 0–30k | Fresh | Sweet spot — peak reliability |
| 🟡 | 30–60k | Warm | Past recommended reset point |
| 🔥 | 60–100k | Hot | Danger zone for coding tasks |
| 💀 | 100k+ | Rot | Broadly degraded quality |
pi install npm:pi-dumb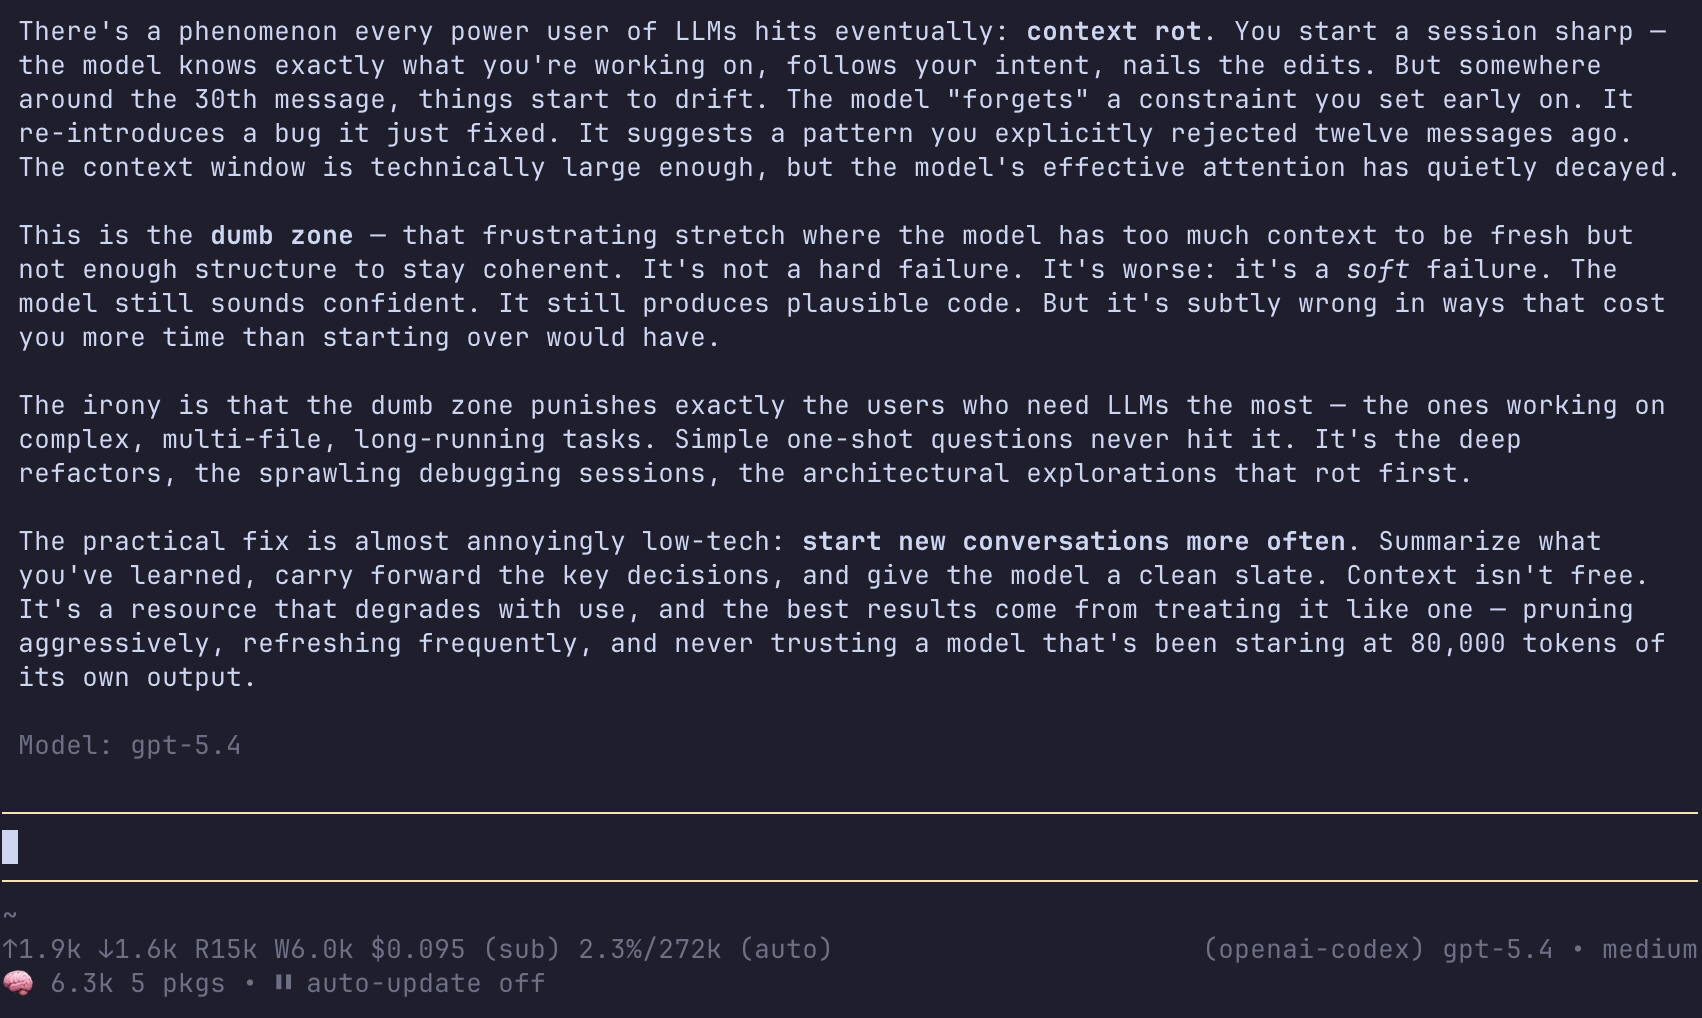
The indicator lives in your status bar (bottom left). After each turn it updates:
🧠 12.4k     # you're good
🟡 45k       # consider compacting
🔥 82k       # quality is dropping, compact soon
💀 142k      # you should have compacted yesterday
MIT