2022-2 Machine Learning Project ( Team Crong )
✅ We wrote the code on Google Colab. Here is our Colab notebook.
https://colab.research.google.com/drive/1zJUm-ulgHRSWLjiItuUfvvxZxjyxWD3K?usp=sharing
✅ You can reproduce our code in this notebook.
✅ Each time the runtime is restarted, the value of performance metric may change.

We noticed the main cause of medication errors as medical staff’s mistake. To prevent such accidents, we decided to apply a model that prescribes medications that are appropriate for a specific patient.
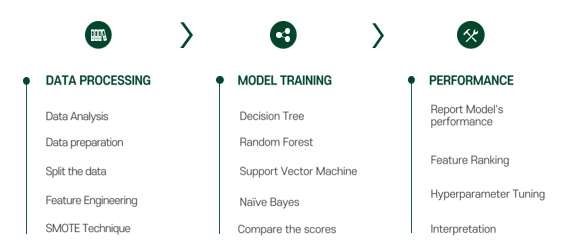
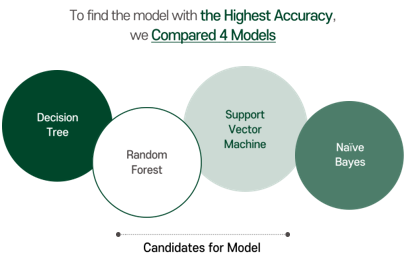
To examine the highest accuracy, we compared 4 candidates, including decision tree, random forest, svm, and naïve bayes.
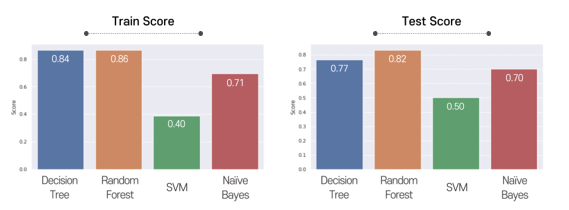
This graph shows training and testing scores. We finally chose random forest because it showed the highest accuracy.
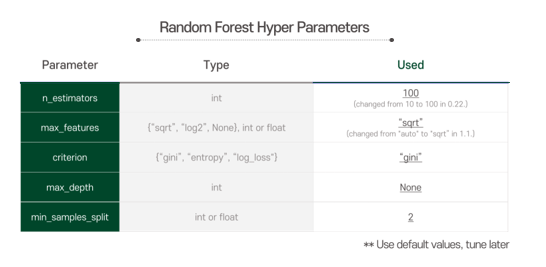
At first, we used given representative parameters as default values, and tuned them later on at the hyperparameter tuning process referring to the model performance.
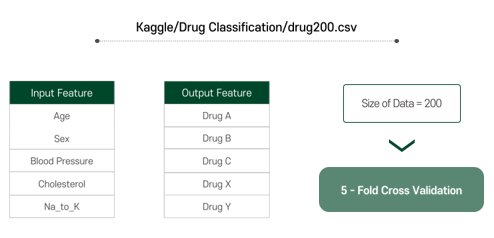
There are five input features, and the outputs are classified into 5 different types. The dataset size is 200, and we used 5-fold cross validation for more efficient use of data.
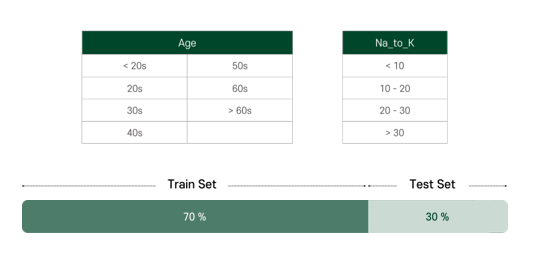
For more efficient learning, we categorized the features ourselves. Age and Na_to_K are categorized by the range as shown, and others are set as binary as we can see in the result. The dataset was split into 70% of train set and 30% of test set.
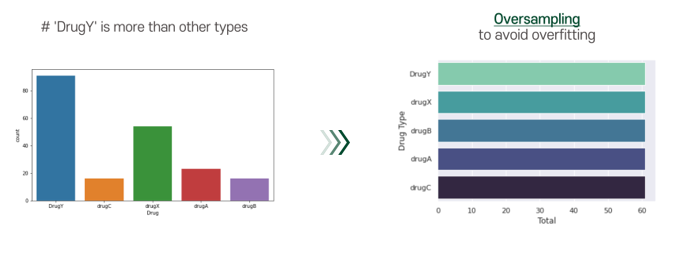
A problem of our dataset is that the number of drugY cases was too many. To avoid overfitting, we applied smote technique. By applying smote technique, we can conduct oversampling for our dataset.
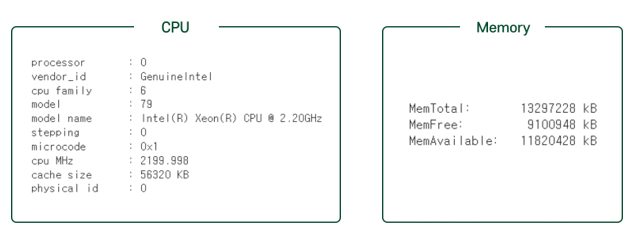
The cpu and memory was normal size, and for our project, the resource was enough.
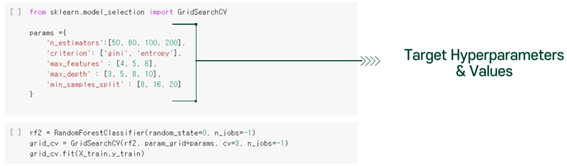
To improve our Random Forest classifier’s performance, we do hyperparameter tuning. The target parameters and values are as below.
After tuning, we get best parameters and best accuracy.
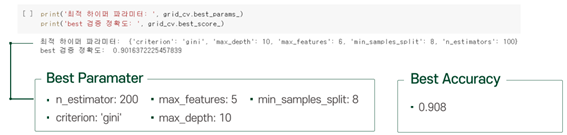
The accuracy of our model with best parameters is about 0.91. The initial accuracy of the model is about 0.879. Therefore, after hyperparameter tuning, we can get the better model.
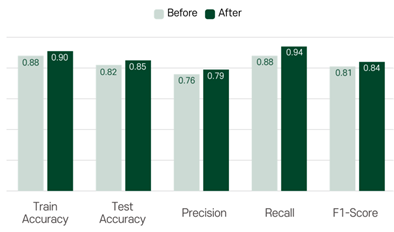
Now, let’s compare the results before and after hyperparameter tuning. The accuracy, precision, recall and f1-score changed as follows. As you can see, all values increased slightly. If you want to check the exact code, please refer to the our ipynb file.
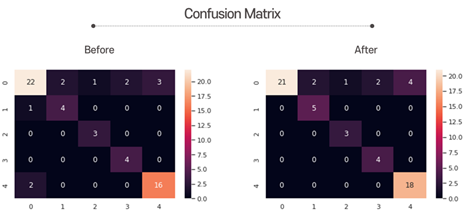
Here is the confusion matrix. There was no significant change, but the accurate predictions corresponding to the diagonal elements increased slightly.
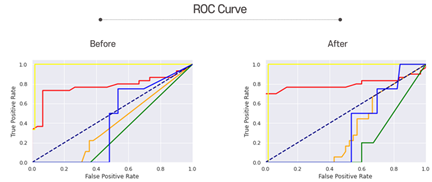
Next is the ROC curves. The closer the graph is to the upper left, the better the performance. You can see that some graphs have gone up to the upper left after hyperparameter tuning.
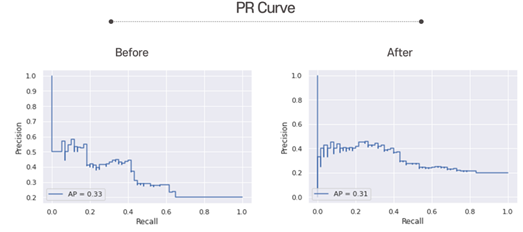
Here is the PR curves. The closer the graph is to the upper right, the better the performance. You can see the graph have gone up to the upper right after hyperparameter tuning.
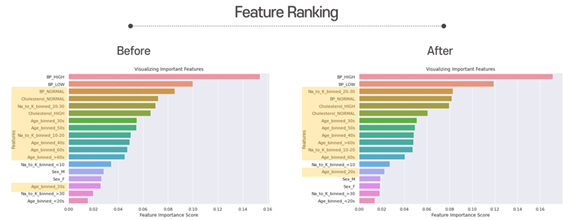
These are the feature Ranking. As you can see, after hyperparameter tuning, “Na_to_K_binned_20-30” got more importance. But overall, “Blood Pressure” is still the most important feature. Besides that, “Cholesterol_NORMAL” and “Na_to_K_binned_10-20” is less important than before. The yellow features are the ones that have changed.
As a result of comparing performance using evaluation metrics, it can be said that performance has improved after hyperparameter tuning.
We wil check if our new model prescribes to new patient properly. Let’s set the new patient’s feature list, and predict on that data.
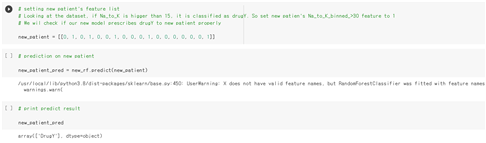
As we expected, the drugY is prescribed to the new patient. This shows that our new model presribed well enough to new patients.
Now let's look at the relationship between our model's predictions and the input features. The correlation graphs between each feature and drug type are as follows.
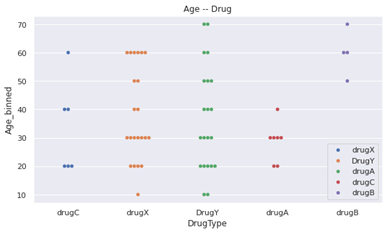
- drugC and drugA are not taken by the children and teenager, whose ages are between 0 and 19.
- drugA is taken only by the younger than 50 years old.
- drugB is taken only by the older than 50 years old.
- DrugY is taken by all ages.
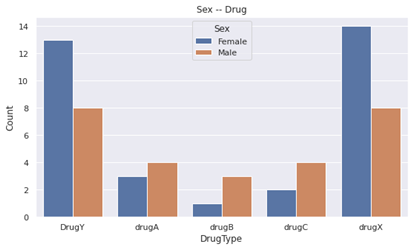
- Male people got drugA, drugB and drugC more than female people did.
- Female people got DrugY and drugX more than male people did.
- Just by this, 'sex' becomes quite appropriate feature for classification compared to beginning.
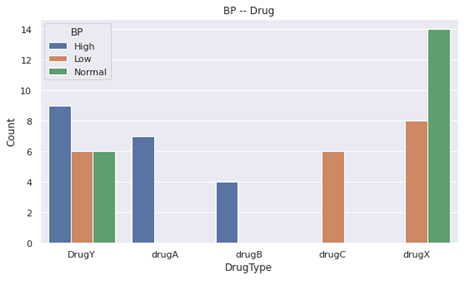
- drugA and drugB were given only to people with HIGH blood pressure.
- drugC was given to people with LOW blood pressure.
- drugX was Not given to people with HIGH blood pressure.
- Still, BP is an important feature for classification.

- People with Na_to_K ratio bigger than 20, got DrugY.
- Still, Na to K is an important feature for DrugY classification.
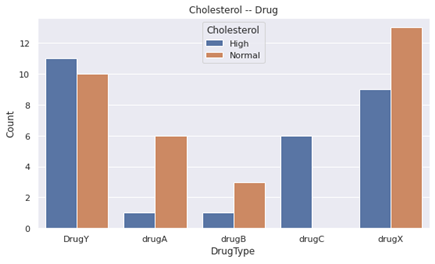
- drugC was only given to people with HIGH cholesterol.
- Cholesterol is an important feature to classify drugC.
- Compared to the beginning, drugA and drugB is almost given to the people who have Normal cholesterol.
- Therefore, drugA and drugB become an important feature to classify drugA and drugB.
As shown below, 9 misclassifications occurred for a total of 60 test sets.
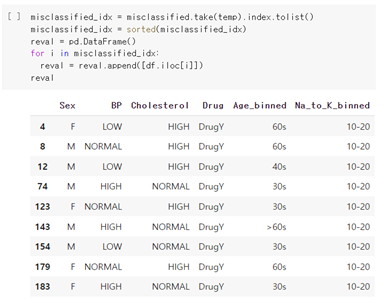
Then, let’s see the feature distributions of misclassified data.
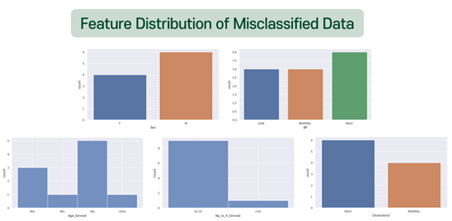
There was no significant difference between the misclassified data, and the predicted result values did not show any obvious tendencies. One notable point was that Na_to_K 10-20 took a substantial proportion. This seems to be due to the ambiguity that can be classified into all drug types if they belong to this group. Also, people who should have been prescribed DrugY were likely to be misclassified, which is suspected to be due to the universal range of data. Therefore, the cause of the misclassified data is thought to be the ambiguity of classifying boundary values.
