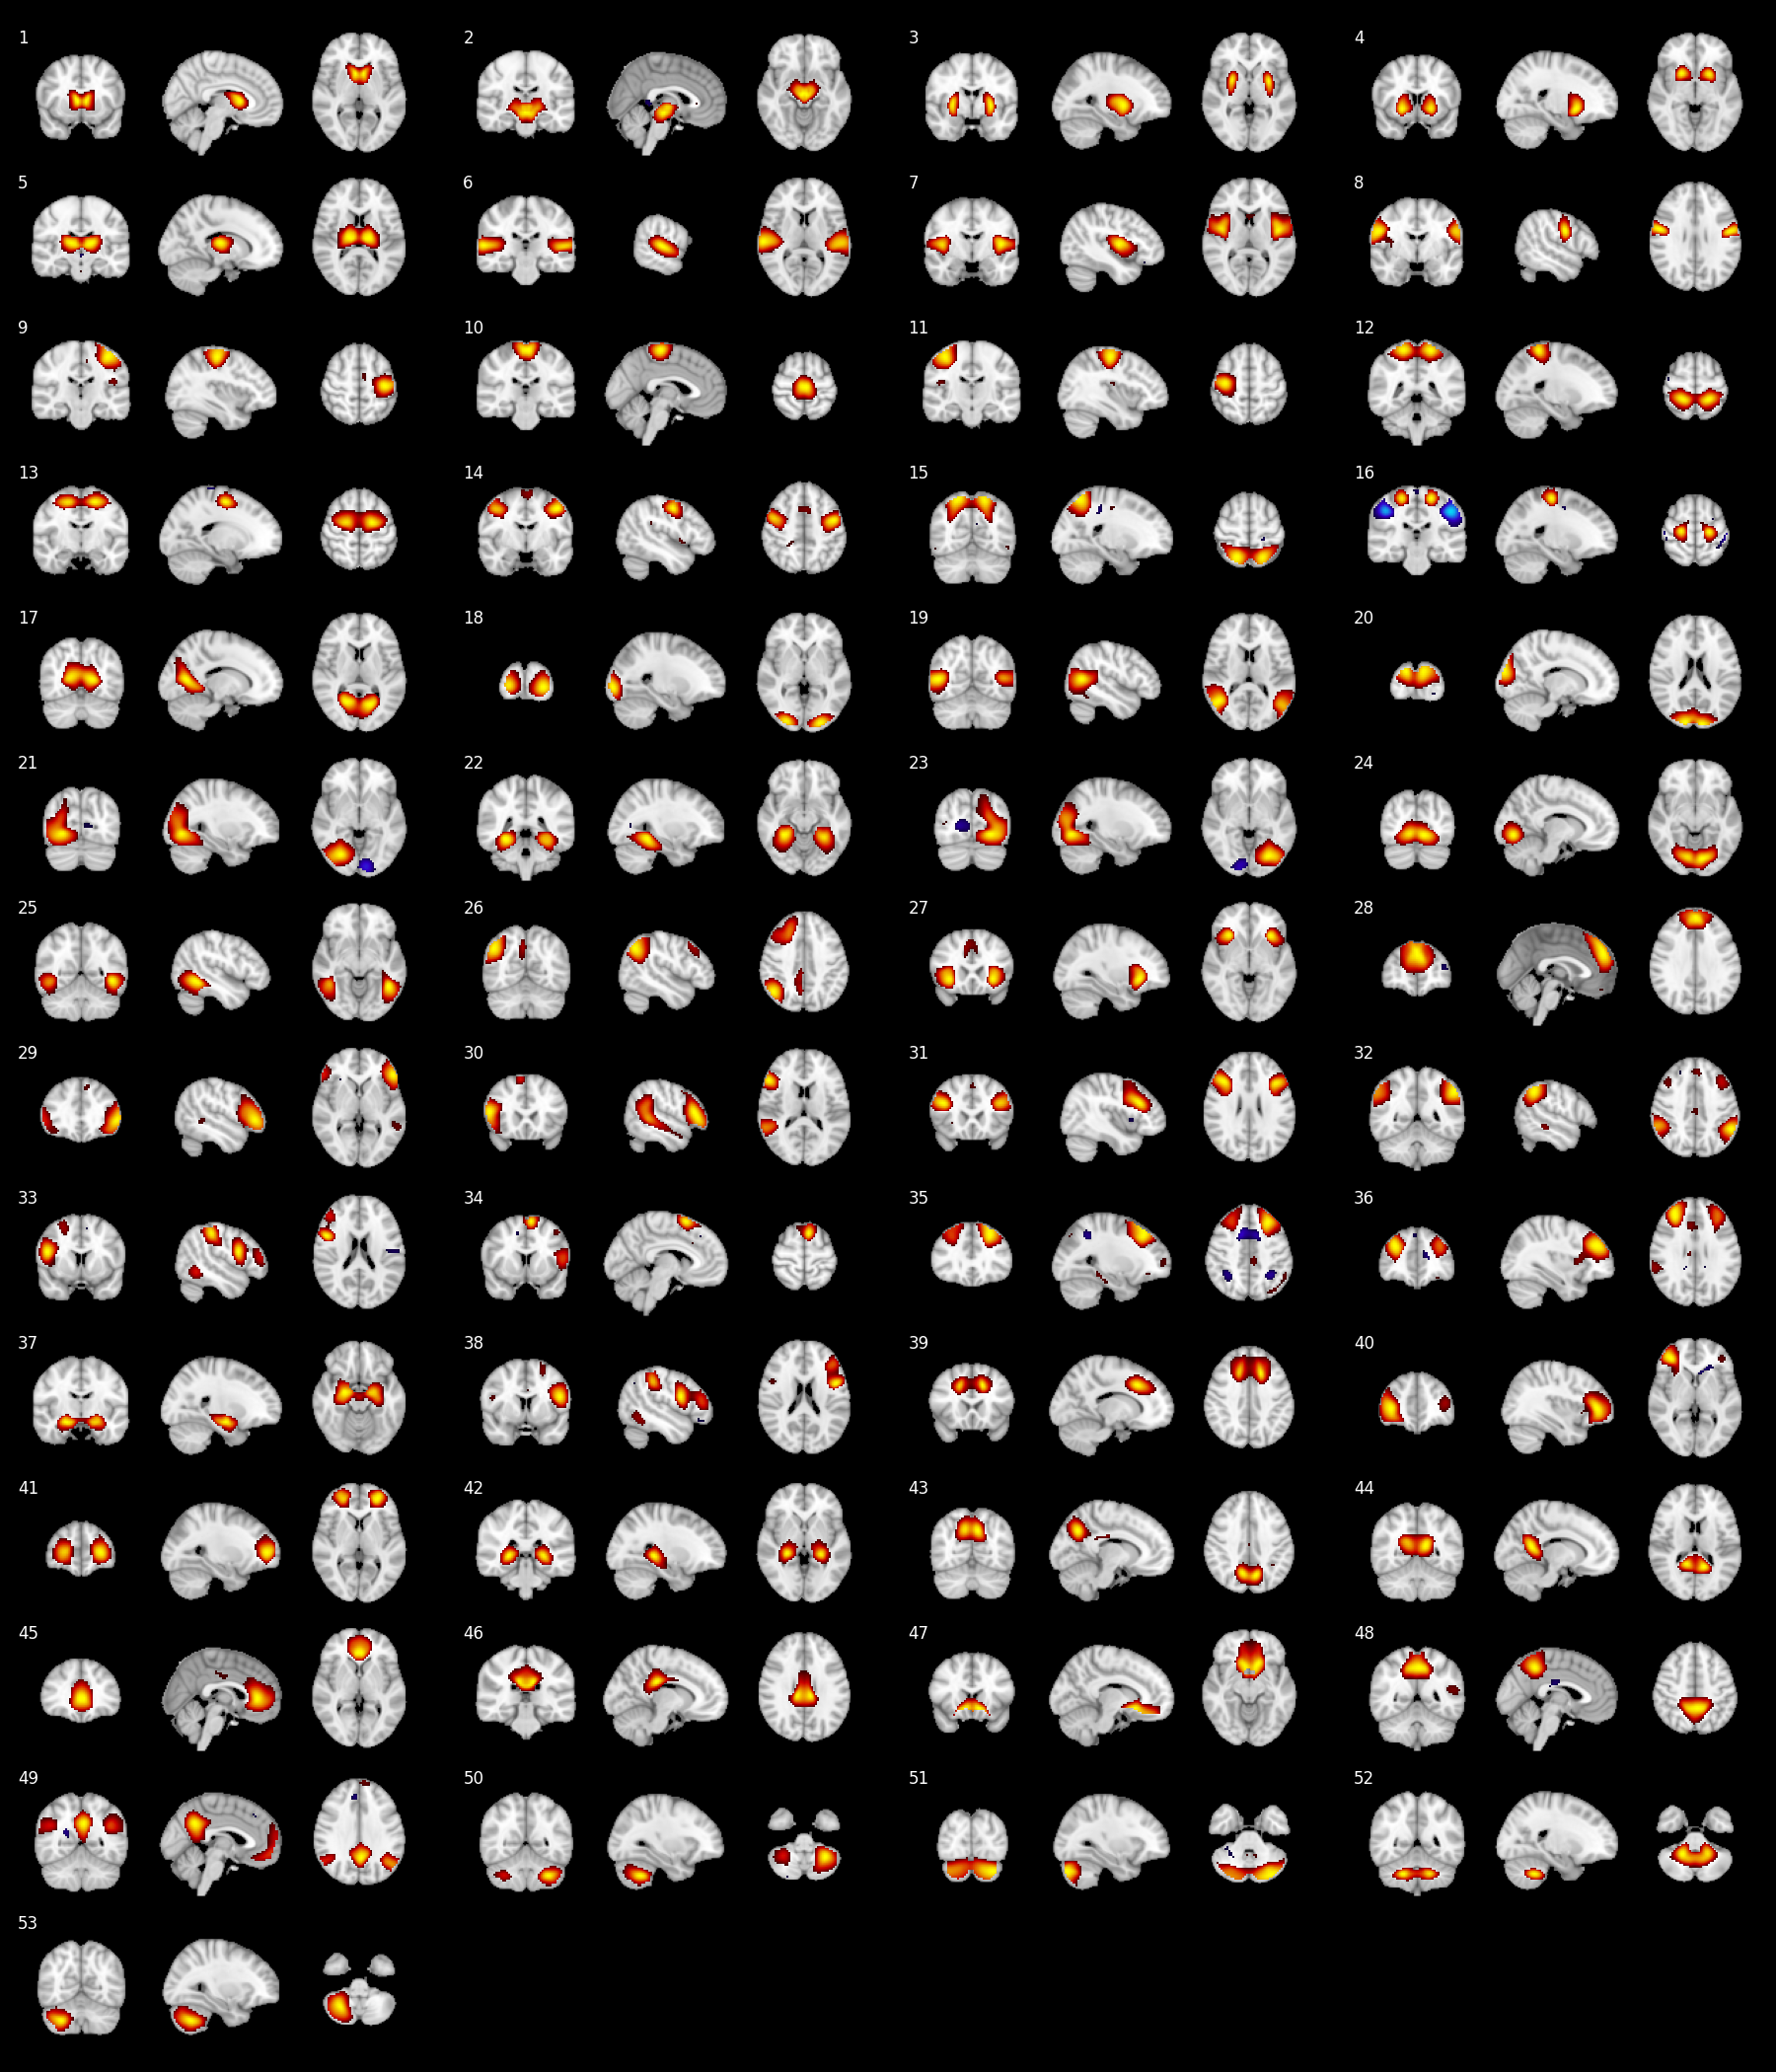
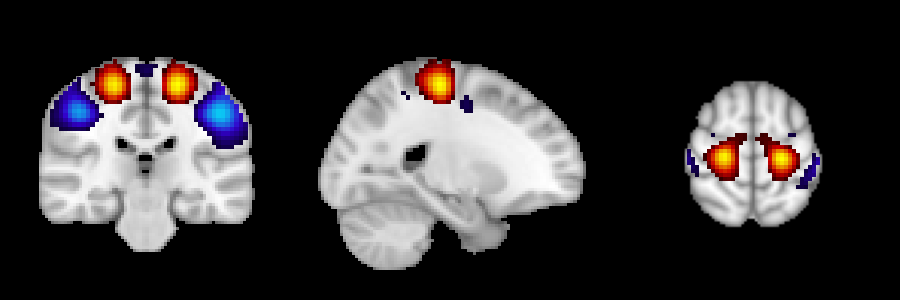
Script for visualizing ICA/ROI brain parcellation
pip install brainbow
brainbow -n {your_brain_map}.nii
- provide a path to nifti map (
-n/--niftiflag) and anatomical underlay (-a/--anatflag, optional) - control the output with
--sign,--thr, and--no-normflags - to plot only certain components use
-c/--componentflag - to set cut coordinates manually use
--cutflag - see below for more info
-
-n/--nifti- path to the nifti file with 4D ICA map to convert to images (last dimension is components), or
- path to the nifti file with 3D ROI map to convert to images (int values from 0 to
n_regions); - required
-
-a/--anat- path to the anatomical image to use as an underlay
- if none is provided, the MNI 152 template is used as an underlay
-
-o/--output- name of the output file(s)
- default -
brainbow-output.png/svg - You can specify the exact extension (
pngorsvg). If none is provided, files with both extensions will be created
-
--rich- if
--richis passed, in addition to the basic output a config file and a csv file containing cut coordinates is generated
- if
-
-s/--sign- choices:
pos, neg, both - used for leaving only positive (
pos), only negative (neg), or all values (both) in the components - ALSO controls the colormap
- choices:
-
--thr- threshold value for component significance
- if component is significant,
thris used to mask values:-thr < value < thr - if all abs values in the component are below
thr, component won't be visualized - default -
0.2
-
--no-norm- use to disable data normalization
- normalization includes:
- centering around median,
- divsion by the max abs value, and
- divsion by the sign (
1 or -1) of this max abs value
-
--extend- if passed, in addition to overlay+underlay picture each component
will also have a row with separate overlay/underlay - helpful for QC
- if passed, in addition to overlay+underlay picture each component
-
--dpi- dpi for png output
- default -
150
-
--annotate- choices:
none, minimal, full - show components indices (
minimal), components indices and cut coordinates (full), or nothing (none) on the output figure - default -
minimal
- choices:
-
-c/--components- allows to provide a list of components to plot (e.g., '42 4 2')
- enumeration starts with 1
-
--cut- allows to set the cut coordinates manually
- default behavior is to use the coordinates of the max abs value of each component
- needs to be either:
- a path to scv file (like the one created by
--richflag), or - a comma separated list of 3 cooridnates, which will be used for all components.
- a path to scv file (like the one created by
- coordinates order should be RAS+
- be careful when using with
--componentsflag: brainbow assumes that the components order in the csv file correspond to the order of the provided components